
Event Analytics
View historical accepted events to monitor event volume and consumption
Event Analytics
The Event Analytics Dashboard allows you to view historical accepted events to identify past trends in volume. This information can help pinpoint times of peak load, or troubleshoot greater-than-expected volumes.
For consumption-based billing accounts, this is the "billable accepted events" under your pricing plan. This data can help you anticipate yearly event volumes and monitor your event consumption relative to your yearly budget.
AvailabilityAvailable on Professional, Business, and Enterprise plans, as well as Operations Cloud accounts.
Accepted Events
Accepted events are any valid events that are sent to and processed by PagerDuty via email integration or API with a successful 2XX response. The number of events should correlate with the number of 2XX responses you receive from the Events API.
This means that all accepted events are counted, including:
- Events sent to Events API v1, Events API v2, x-ere, etc.
- API events sent to a service key or a Global Orchestration
- Email events
- Trigger, resolve, and acknowledge event actions
- Deduplicated or suppressed events
- Events sent to a service in maintenance mode
- Events sent to a disabled service
- Redundant resolves where a service continues to send resolves on the same incident
- Events that are later dropped due to rules or event transformations
Events that are not counted include:
- Events rejected at the API due to rate limiting, throttling, or an error
- Events sent to deleted routing keys (integrations or orchestrations) — these do receive a
2XXresponse for security reasons - Change events
- REST API calls
- Incidents created through the REST API, including manually created incidents in the web app or mobile app
The Event Analytics Dashboard provides a comprehensive view of your event journey. It expands beyond simple volume reporting to help Admins and Account Owners understand exactly what happens to events as they flow through PagerDuty — from the moment they are received to their final outcome.
View the Event Analytics Dashboard
- Navigate to Analytics Insights Events.
- Select the date picker to choose a date range, then click Apply.
- Select the icon to access the following filters:
- Team
- Routing key
- Integration
- Service
- When finished, click Apply filters.
Dashboard Components
The dashboard is laid out in three zones:
- Total Events: Shows Total Events and AIOps Events for the selected range. Each metric includes a period-over-period delta (up/down arrow and absolute change). Invalid or failed events are excluded.
- Events & Incidents Chart: A stacked bar chart showing daily volume across three series: Incidents, AIOps Events, and Non-AIOps Events.
- Events Breakdown Charts: Two stacked bar charts showing volume by Outcome and Sub-outcome over time.
Total Events
Shows total events for the selected range, alongside an AIOps Events sub-total. Each metric is paired with a period-over-period delta indicator (up/down arrow and absolute change vs. the prior comparable range, e.g., "compared to Mar 1 – Mar 31, 2026").
Events & Incidents Chart
A stacked bar chart showing daily volume across three series: Incidents, AIOps Events, and Non-AIOps Events. AIOps events are sent to AIOps services. Incidents represent all incidents triggered by events.
Events Breakdown Charts
Two stacked bar charts showing a breakdown of the Outcome and Sub-outcome of events over time.
Events by Outcome (What Happened)
Outcomes represent the final state of an event in the PagerDuty workflow. These include:
- Triggered: The event resulted in a new triggered incident.
- Triggered Deduped: The event was deduplicated onto an existing open incident.
- Suppressed: The event was silenced by an event rule or service setting.
- Suspended: The event was held pending further evaluation (e.g., Auto-Pause).
- Suspended Deduped: Suspended event that matched an existing suspended event.
- Acknowledged: Event was acknowledged on arrival.
- Resolved: The event resolved an existing incident.
- Dropped: The event was permanently discarded by an orchestration rule.
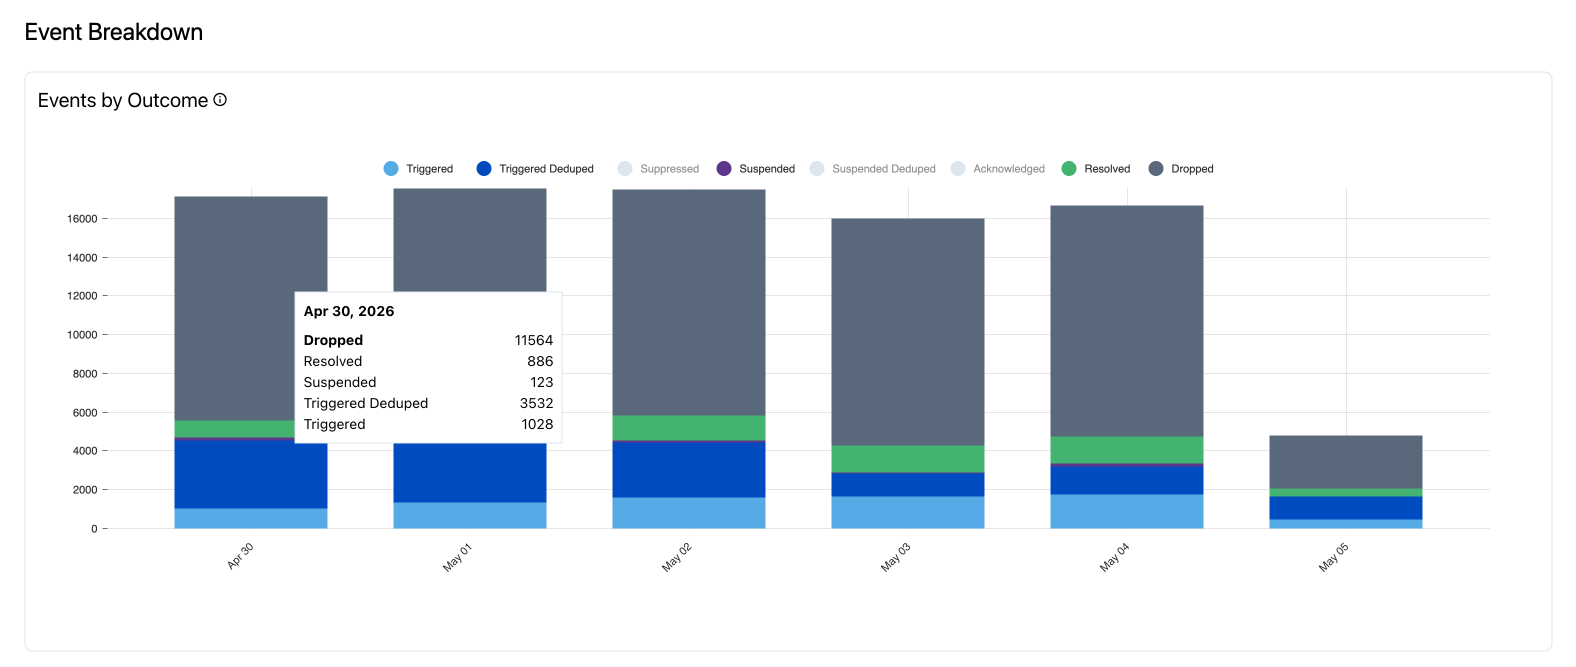
Events by Outcome
Events by Sub-outcome (Why It Happened)
Sub-outcomes provide granular diagnostic signals. Sub-outcomes include:
- Alert
- Alert and Incident
- Incident
- Email Filters
- Event Orchestration
- Recent Event found
- Unable to assign Incident
- Incident not found
- Disabled Service
- Other
Identifying sub-outcomes like "Incident not found" or "Disabled Service" can help you quickly find and fix misconfigurations.
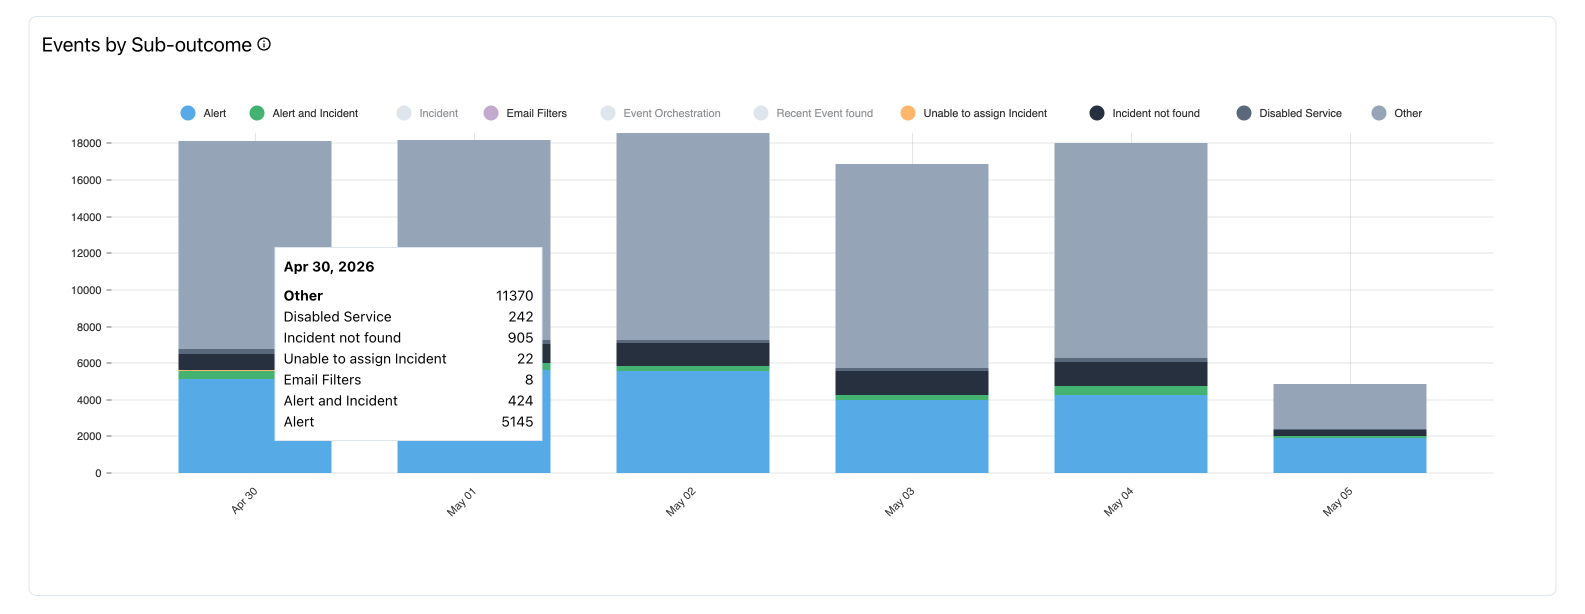
Events by Sub-outcome
Events Breakdown Table
The Events Breakdown table identifies the specific integrations and services driving event volume. It supports search, sorting (Total Events sorts descending by default), pagination, and CSV export.
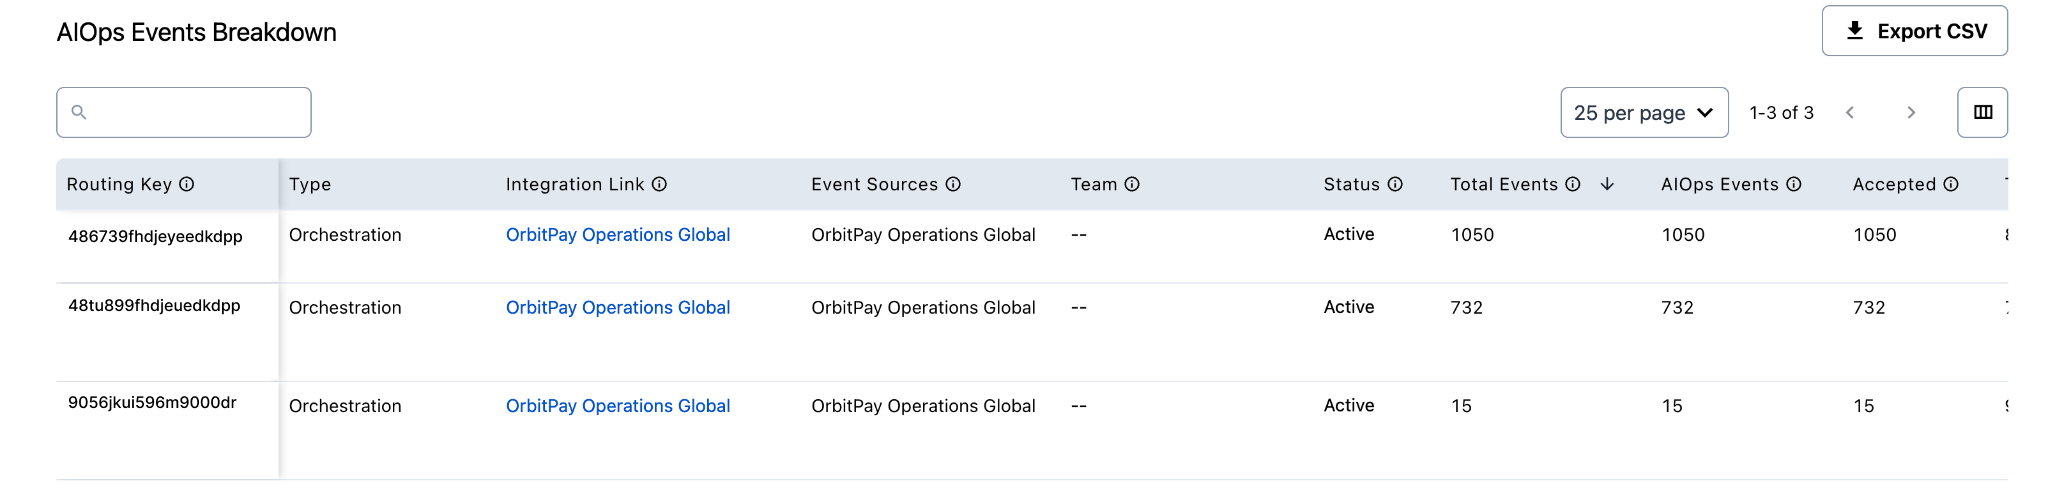
Events breakdown table
CSV Export LimitCSV exports from the Events Breakdown table are limited to 1,000 rows. For larger export needs, use the Event Analytics API (currently in Early Access).
Table Columns
- Routing Key: The unique identifier for the integration. Full keys are visible to Admins only.
- Type: e.g., Orchestration, Service, etc.
- Integration Link: Clickable link to navigate directly to the ruleset, service, or orchestration associated with the key.
- Event Sources: Source of event (e.g., Datadog, AWS, Events API v2).
- Team: Team listed as owning the ruleset, service, or orchestration.
- Status: Active, etc.
- Total Events: The gross volume of events received. Total accepted events can be events sent via email integration or the Events API. This does not include rejected, rate-limited, or invalid events.
- AIOps Events: Event sources processed with services or orchestrations that have AIOps enabled.
Typical Workflows
- Check the headline: Review Total Events and the period-over-period delta to confirm whether volume is trending up or down.
- Spot the spike: Use the Events & Incidents chart to identify days with abnormal volume.
- Diagnose what happened to the events: Use the Events by Outcome chart to see whether the volume turned into incidents, was suppressed, or was dropped.
- Diagnose why: Use the Events by Sub-outcome chart to see which sub-outcome (e.g., Event Orchestration, Disabled Service) is driving the pattern.
- Find the source: Use the Events Breakdown table — sorted by Total Events descending — to identify the specific routing keys, integrations, and services contributing the most volume.
- Drill in: Click the Integration Link in the table to navigate directly to the integration. From there, you can tune the monitor, update the event rule, or re-enable a misconfigured service.
- Export for further analysis: Use Export CSV to pull the table into a spreadsheet or BI tool.
Updated 21 days ago