Common Event Format (PD-CEF)
The PagerDuty Common Event Format (PD-CEF) is a standardized alert format that allows PagerDuty to correlate similar items across integrations and better understand the events from your environment. PD-CEF also allows you to view alert and incident data in a cleaner, more normalized way. You can also use PD-CEF to dynamically suppress non-actionable alerts with Event Orchestration.
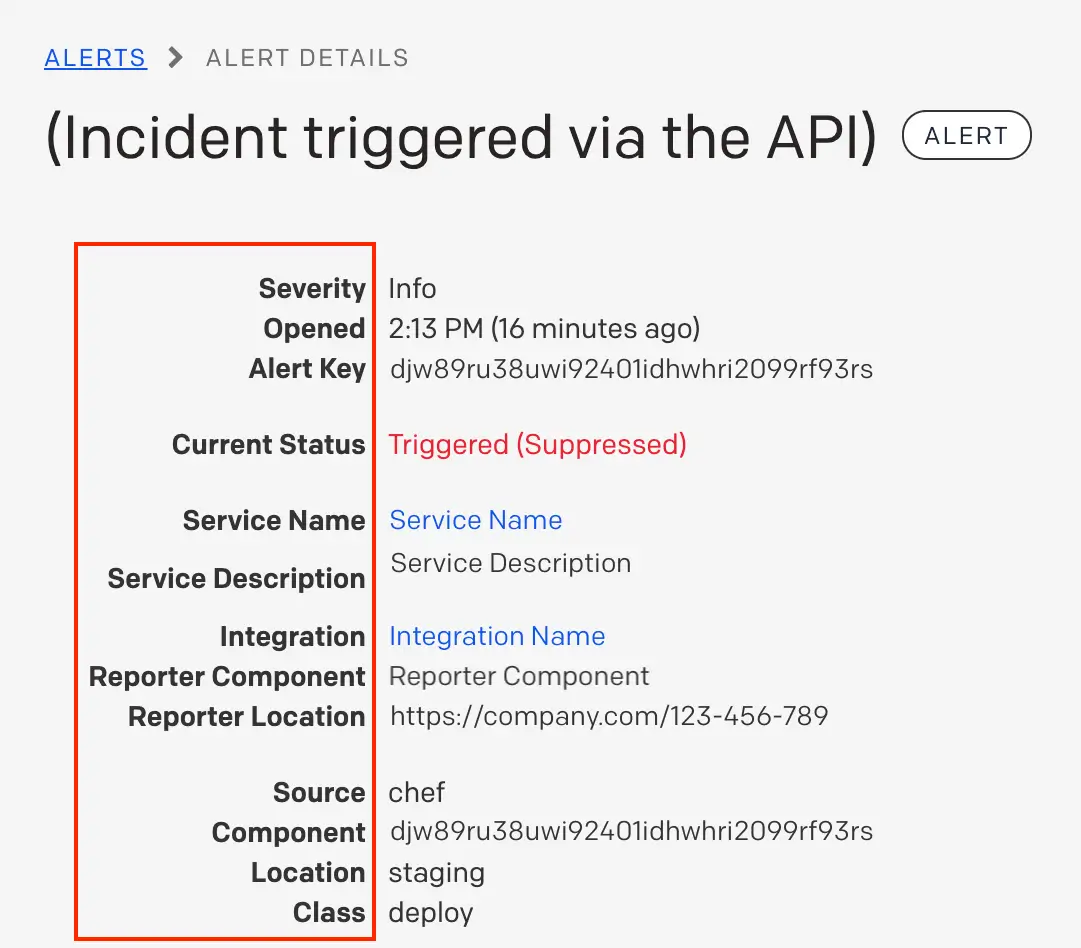
PD-CEF details display at the top of alert and incident detail pages. They express common event concepts in a normalized, readable way.
PD-CEF Fields
The table below outlines the name, type and description of each PD-CEF field, as well as an example value for each.
| Name | Description | Type | Required? | Example Value |
|---|---|---|---|---|
| Summary | A high-level, text summary message of the event. Will be used to construct an alert's summary. | String | Required | "PING OK - Packet loss = 0%, RTA = 1.41 ms""Host 'acme-andromeda-sv1-c40 :: 179.21.24.50' is DOWN" |
| Severity | Indicates the severity of the impact to the affected system. | Enum | Required | {Info, Warning, Error, Critical} |
| Source | Specific human-readable unique identifier, such as a hostname, for the system having the problem. | String | Required |
|
| Timestamp | When the upstream system detected / created the event. This is useful if a system batches or holds events before sending them to PagerDuty. | Timestamp | Optional - Will be auto-generated by PagerDuty if not provided. | 2015-07-17T08:42:58.315+0000 |
| Component | The part or component of the affected system that is broken. | String | Optional |
|
| Group | A cluster or grouping of sources. For example, sources “prod-datapipe-02” and “prod-datapipe-03” might both be part of “prod-datapipe” | String | Optional |
|
| Class | The class/type of the event. | String | Optional |
|
| Custom Details | Free-form details from the event. | Object | Optional | {"ping time": "1500ms", "load avg": 0.75 } |
PD-CEF Fields on an Alert
Below is an example of what PD-CEF information on an alert might look like in the web app:

PD-CEF fields on an Alert
PD-CEF in the Alerts Table
The alerts table highlights PD-CEF fields in your alerts: Severity, Summary, Source, Class, Component, and Group. To customize the fields shown on the Alerts table, navigate to Incidents Alerts and click Customize Columns on the right side.
Events API v2
The Events API v2 offers a streamlined way to use PD-CEF fields in your alerts. Monitoring partners can now directly send events in the PD-CEF format, giving you the benefit of the format without the need to manually convert your events. Custom monitoring can also use this format to take advantage of the PD-CEF display and workflow features in PagerDuty.
Review our developer documentation for more information about the Events API v2 and how to use it.
Example PD-CEF Payload
The following example shows PD-CEF fields inside an Events API v2 trigger event's payload:
{
  "payload": {
    "summary": "Example alert on host1.example.com",
    "timestamp": "2015-07-17T08:42:58.315+0000",
    "source": "monitoringtool:cloudvendor:central-region-dc-01:852559987:cluster/api-stats-prod-003",
    "severity": "info",
    "component": "postgres",
    "group": "prod-datapipe",
    "class": "deploy",
    "custom_details": {
      "ping time": "1500ms",
      "load avg": 0.75
    }
  } ...
}
Updated about 1 month ago
