
Alerts Table
View and take action on incident alerts
The Alerts Table allows you to view and sort alerts according to your preferences, helping you locate what you're looking for quickly and efficiently.
Required User PermissionsThe Alerts Table only shows alerts from services you have access to. Visible alerts may be restricted by your Base Role, Team Role, or Object Role. To view alerts from a specific service, contact the appropriate Team Manager, Global Admin, or Account Owner to grant access.
When using Event Orchestration, alerts that are suppressed and not routed to a service are only visible to administrators.
View the Alerts Table
Navigate to the Alerts Table in the PagerDuty web app by selecting Incidents Alerts.
By default, the Alerts Table displays alerts from the Last 30 days. To adjust the time range:
- In the Created column, click on the right.
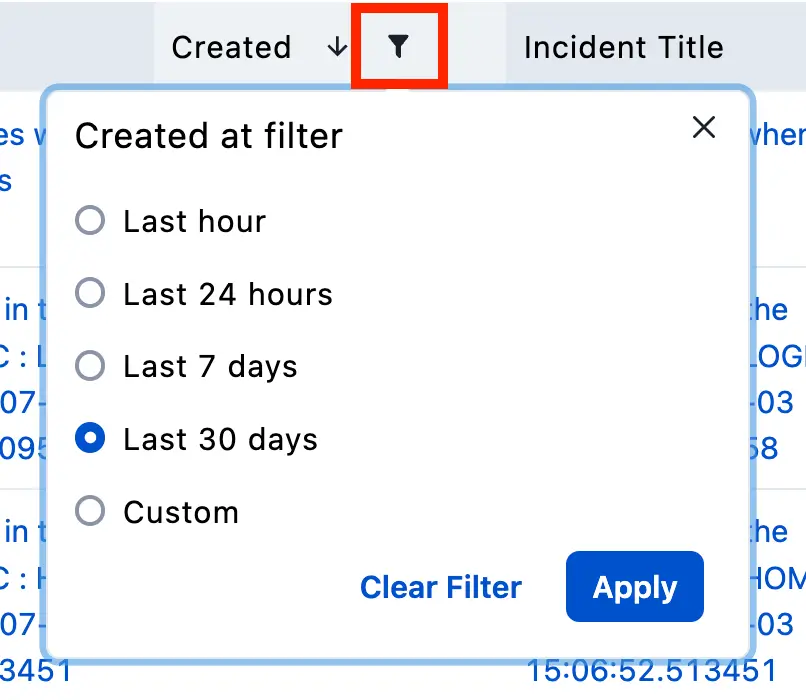
Filter the Created column
- Select one of the following time range options:
- Last hour
- Last 24 hours
- Last 7 days
- Last 30 days (default)
- Custom
- Click Apply.
Alerts Table Columns
Alerts are filtered via the columns that appear in the Alerts Table. The type of filter (for example, radio button or search) varies based on column data type.
The columns Severity, Summary, Source, Class, Component, and Group all map to Common Event Format (PD-CEF) fields, which can be included in your events with the Events API v2.
The Status column indicates whether alerts are triggered, resolved, suppressed, or suspended. Created indicates the date and time the alert was created.
Incident Title points to the incident your alerts are grouped under. Service and Integration point to the service and integration your alerts are associated with.
Show and Hide Columns
Customize Columns lets you show or hide the Incident Title, Service, Integration, Source, Class, Component, and Group columns. The Status, Severity, Summary, and Created columns cannot be disabled and are grayed out in the Customize Columns menu.
Incident Title, Service, Integration, and Source are enabled by default but can be hidden.
Search Filtering
Search filtering is enabled on the Summary, Incident Title, Integration, Source, Class, Component, and Group columns. Partial matches are displayed — for example, searching Prod shows results for both prod04 and Prod03.
Sort Filtering
You can sort most columns. The default sort is by Status (that is, Triggered, Resolved, Triggered (Suppressed), Resolved (Suppressed), or Suspended). Sortable columns display or when you hover over the column name. Click the arrow to sort by that column. The active sort column shows an arrow; other columns do not.

Sorted by status
Active Filters Bar
The active filters bar at the top of the Alerts Table tracks which filters are enabled. Column tags populate the bar, and filter icons highlight blue when filters are active.
The following image shows the Alerts Table with active Severity and Status filters:
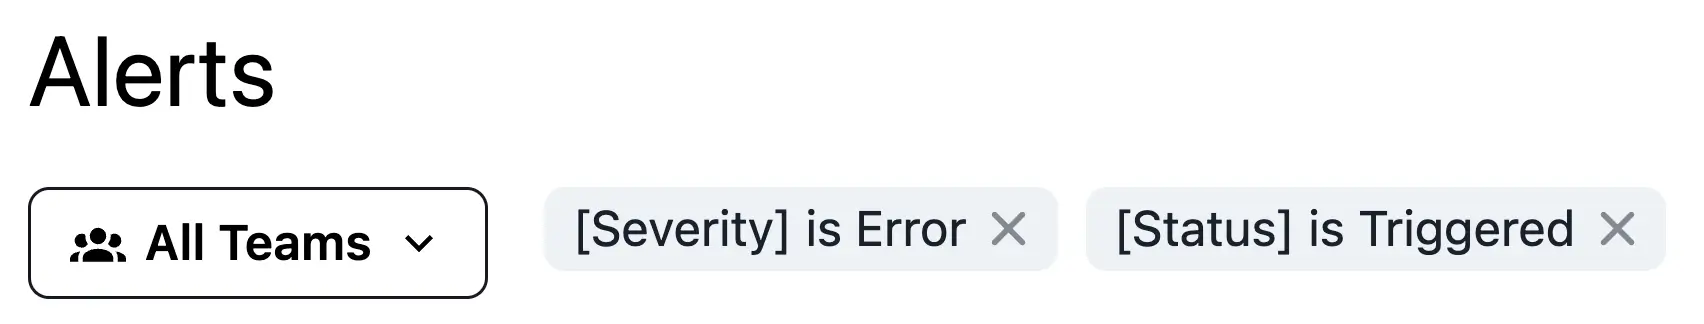
Active Severity and Status filters
Clear Table Filters
Clear table filters from the Active Filters Bar by clicking next to each individual filter. You can also remove a search filter by clicking the search icon a second time and selecting Clear filter.
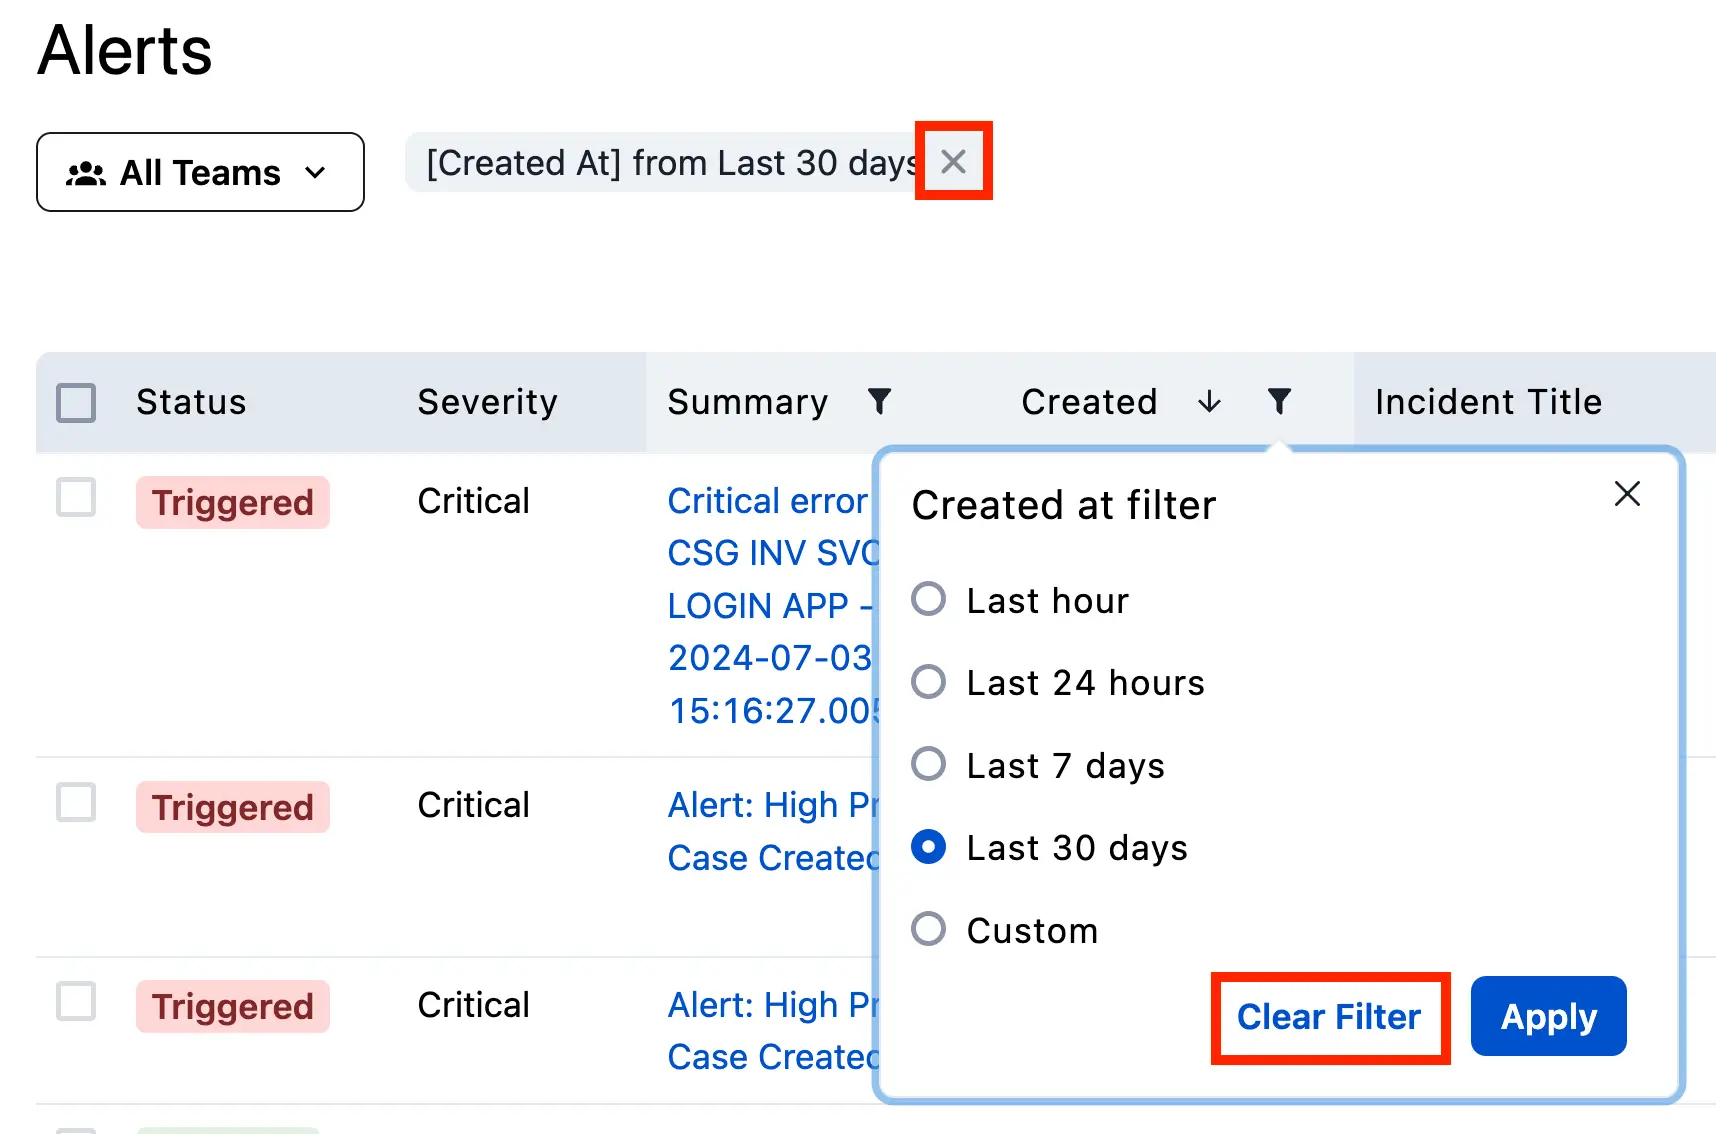
Clear table filters
Alert Actions
You can perform actions on alerts that are triggered, triggered (suppressed), or suspended.
Triggered Alerts
Resolve triggered alerts — including suppressed triggered alerts — by selecting the checkbox to the left of the alert and clicking Resolve at the bottom of the screen.
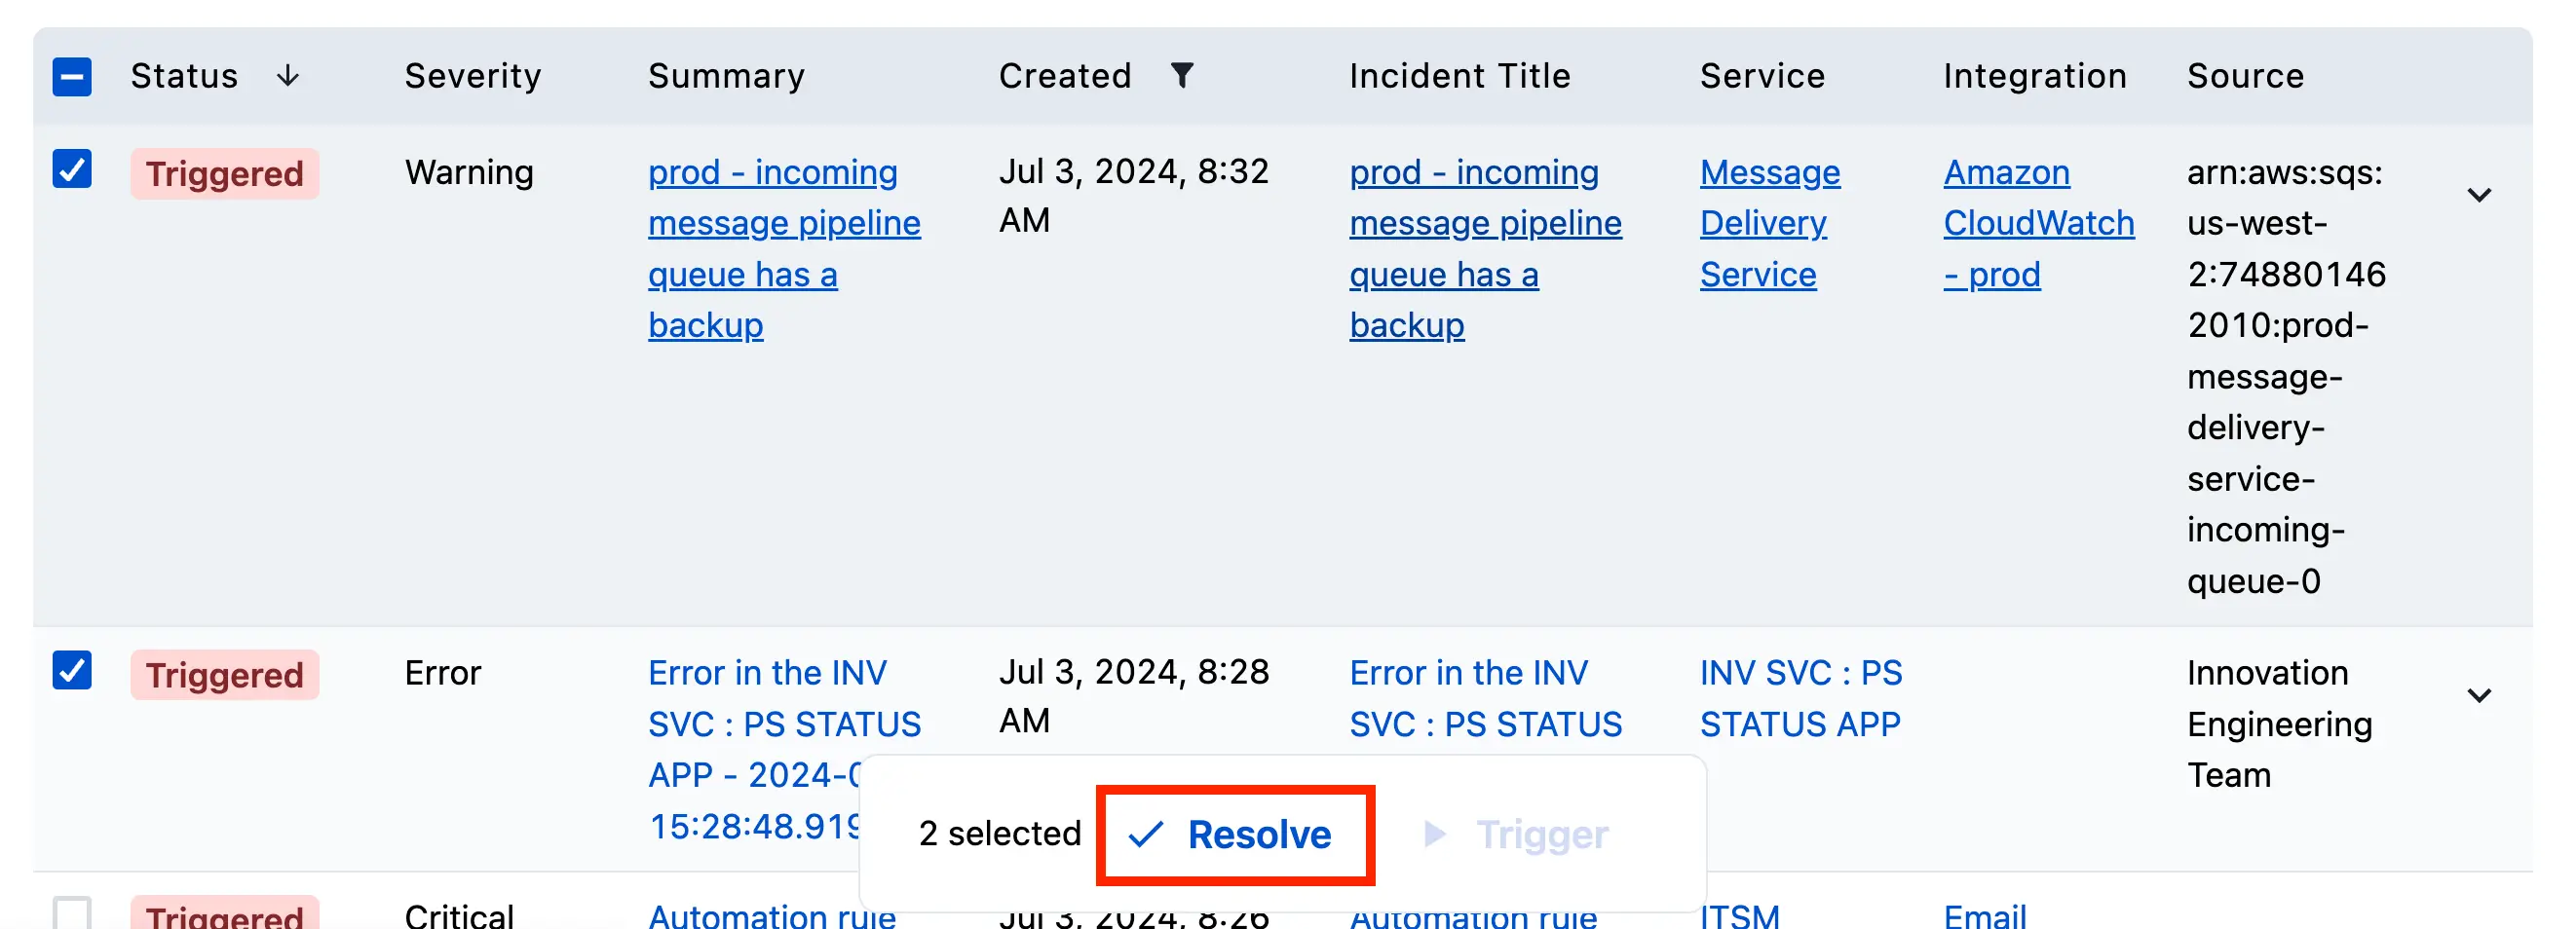
Resolve triggered alerts
Suspended Alerts
You can configure Event Orchestration to generate Suspended alerts, which do not immediately trigger an incident or send responder notifications. Suspended alerts can be triggered or resolved by selecting the checkbox to the left of the alert and clicking Trigger or Resolve. Refer to Event Orchestration: Pause Incident Notifications for more information.
Updated about 1 month ago