
PagerDuty AIOps Quickstart Guide
Set up PagerDuty AIOps in 90 minutes
For many teams, adopting PagerDuty AIOps is key to seeing fewer incidents and faster resolution. This guide provides instructions to configure PagerDuty AIOps in 90 minutes, and in that short amount of time you can see less noise and reduce toil across your services.
Create Better ServicesA service is defined as a discrete piece of functionality owned by a single team. Creating better services helps the ML model improve accuracy of triage context and Intelligent Alert Grouping. Refer to the Service Standards guide to learn more about how to correctly create services in PagerDuty.
Operations Console (5 Minutes)
Many organizations look for a centralized overview during incident response. The Operations Console is the best place to understand your operations' current state. It offers live visibility into incidents, and you can create customized views to triage and take immediate action on issues.
The Operations Console offers:
- Filters and Searches: Need to focus on a specific group of incidents? Leverage a configurable table and filter components (such as Services, Priority, Escalation Policy) to create your refined view.
- Customized and Shared Views: Want to see additional columns? Add, remove, and resize columns in the Operations Console to suit your needs. You can also share your view with your team members so everyone is working from a single source of truth in one centralized location.
- Incident Actions: Need to run an incident workflow or add bulk notes? Take a variety of actions directly within the Operations Console to minimize your MTTA and MTTR.
You can take a guided five-minute product tour. PagerDuty recommends adjusting the filters and columns to build your desired views.
Automation and Orchestration (60 Minutes)
PagerDuty AIOps uses Event Orchestration, an automation engine that allows you to create rules that normalize and enrich your data. There are four components to Event Orchestration that you can configure:
- Integrations: Use Global Integration keys in your monitoring tools to send data to an Event Orchestration.
- Global Orchestrations: Allow multiple services to enrich data according to global sets of rules. ITOps or SRE teams usually create and manage Global Orchestrations.
- Service Routes: Ensure that when certain conditions are met, incidents are routed to the right team.
- Service Event Orchestrations: Create service-level orchestrations to enrich data according to the service owner's criteria. Service-owning teams can self-serve and manage their own Service Event Orchestrations.
You use these components to build the recommended Event Orchestration types below.
Incoming DataBy putting PagerDuty AIOps at the front of your event stream, PagerDuty acts as a centralized overview across monitoring tools and is a force multiplier for automation. To get the most value and best results for noise reduction and automation, all your events should flow through PagerDuty AIOps. To learn about how PagerDuty integrates with your tools, see the integrations page.
For teams just getting started, here are five common use cases for Event Orchestration that PagerDuty recommends creating within your account:
- Service Routing: With Global Integration keys, you can use a single key to ingest all events for all services relevant to your team. After events are ingested, you can configure Service Routing Rules to define how events are distributed to downstream teams. (5-60 minutes, depending on organization size)
- Rules-based Noise Reduction: Event Orchestration has powerful noise reduction actions based on different conditions or scenarios. These tools include suppression, notification pausing, and incident dropping. Create broad conditions that describe classes of events that do not provide value to your teams. Then select the Suppress action to stop those events from generating notifications. (15 minutes)
- Standardized Incident Response Procedures: For well-understood incidents, add notes to incidents when they are created. These notes should define the standard response procedures for the incident. This is especially helpful to have in place for junior responders who need more context. (5-60 minutes depending on your existing documentation)
- Major Incident Management: With Event Cache Orchestration variables, you can quickly identify when a major incident is occurring based on historical event data and adjust how rules are applied in those situations. This can help facilitate incident response during a major incident and ensure the right responders are being pulled in. (15 minutes)
- Automated Incident Triage: Event Orchestration can automatically assign priorities and severities to events when they are ingested, ensuring related incidents are treated correctly. To do this, define all the conditions that describe a high, medium, or low priority incident in your environment and specify the appropriate priority. (15 minutes)
Once you have created these Orchestrations, you will only receive incidents relevant to your team and you will be able to resolve them faster with less toil and better data. Most PagerDuty customers see a reduction in MTTR and are able to create automation faster.
Noise Reduction (20 Minutes)
Noise reduction is a top priority for all teams. It is a significant quality-of-life improvement for incident responders, whether they are a NOC operator or a DevOps engineer.
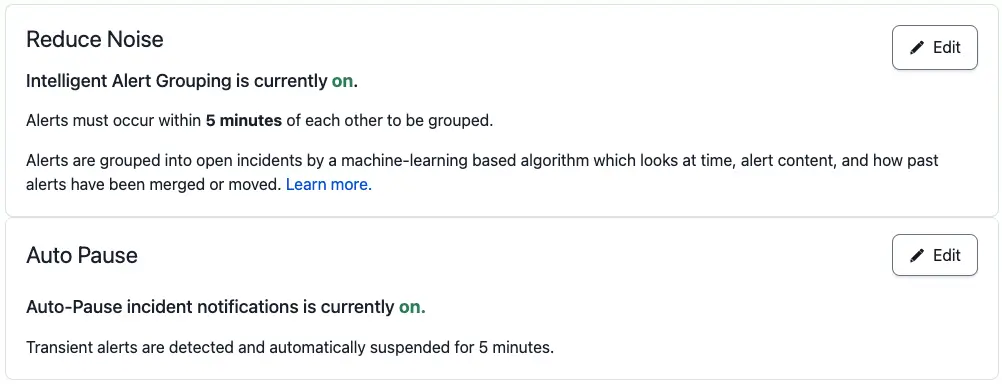
Noise Reduction settings on a service
There are six ways you can set your noise level threshold. PagerDuty recommends that new users configure their noise reduction settings as such:
- Intelligent Alert Grouping: Leverages ML to group related alerts based on previous incident data and human interaction. This option uses a rolling grouping window with a duration between five minutes to an hour. PagerDuty recommends starting with five minutes. If Intelligent Alert Grouping groups an alert incorrectly while it learns, you can regroup the alert. This will train the model to group alerts like this in the future.
- Auto-Pause Incident Notifications: Leverages ML to identify alerts that typically auto-resolve on their own and pauses incident creation. Select a duration ranging from 2-15 minutes. If the alert does not auto-resolve within the configured time period, PagerDuty will create an incident.
Intelligent Alert Grouping is the best way to see immediate noise reduction in the environment. For teams with specific alert grouping requirements, PagerDuty also recommends the following:
- Content-Based Alert Grouping: Create custom alert grouping based on known fields between alerts. Alerts that share an exact match on a set of chosen fields will be grouped together into the most recent open incident. You can even leverage Event Orchestration to add custom details that then are grouped by content.
- Unified Alert Grouping: Combines Content-Based Alert Grouping and Intelligent Alert Grouping with a flexible time window for increased precision and correlation control.
- Global Alert Grouping: Allows you to reduce noise by using Content-Based Alert Grouping to group alerts across multiple technical services.
- Time-Based Alert Grouping: Allows you to group alerts based on a static time increment of your choice, ranging from 2 minutes to 24 hours, or even until the incident is resolved. This option is helpful for services that generate many alerts. PagerDuty recommends starting with 2-5 minutes.
PagerDuty AIOps ML ModelPagerDuty AIOps' unique ML model is always analyzing data signals, so when you turn it on, there is minimal-to-zero training necessary. For existing customers who are new to AIOps, the model starts working immediately, as the platform is continuously learning from responder actions. For new users, the model begins learning as soon as you begin using PagerDuty. The model becomes more accurate as you send more events to PagerDuty, and resolve more incidents.
Triage and Root Cause Analysis (1 Minute)
PagerDuty AIOps comes with several ML triage features to provide you with more context during incident response. This also removes the toil of digging through documentation and post-incident reviews to find the key information you are looking for.
Triage and Root Cause Analysis (RCA) features require zero configuration. When you turn on AIOps, the ML algorithms begin processing data. Similar to other ML-based features, the more data you add to PagerDuty, the more effective these tools are for you and the faster the model learns.
The ML-based triage and RCA features include:
- Outlier Incident: Tells you if an incident is frequent, rare, or an anomaly. Helps responders understand how novel an incident is. The more novel, the more they might want to have help.
- Past Incidents: Shares if an incident like this has occurred in the past, and the incident frequency over the last six months. If so, you can click into the past incident and view incident metadata – like who was involved or what remediation efforts were used.
- Related Incidents: Shows other active incidents within the system that may be related. This helps you understand dependencies and cascading impact of an incident, and it allows you to provide feedback to improve recommendations over time.
- Probable Origin: Determines the most likely service origin of the incident. This scopes the incident and tells you which team to coordinate with for more insights.
- Change Correlation: Uses machine learning to correlate which incidents happen with certain changes. The incident shows recent changes on that service or related services. As most incidents are change-related, this gives you a jump start on triage.
Resources
PagerDuty AIOps Support
If you are a current PagerDuty AIOps customer and you have further questions, read PagerDuty AIOps, or reach out to your account team. If you are interested in PagerDuty AIOps, you can sign up for a trial or take the interactive product tour.
Deeper Learning
To go deeper into the information presented in this article, you can enroll in the PagerDuty University AIOps Knowledge Series, and work towards becoming a PagerDuty-certified AIOps specialist.
Updated about 1 month ago