
Service Graph
Interact with the topology of all technical and business service dependencies in your account
The Service Graph is an interactive mapping of all technical and business service dependencies in your PagerDuty account. With the Service Graph, you can:
- View the health of the full service topology at a glance, identify gaps in service relationships, and seamlessly create dependencies.
- Understand how services combine to deliver customer-facing or business capabilities.
- During incident response, understand the full blast radius of an issue, zero in on the probable cause, and facilitate cross-team collaboration.
Service Graph
View the Service Graph
Requirements
- If you have permission to view each service in a dependency relationship, you can see that relationship in the Service Graph. If you do not have permission to view a service, that service and relationship does not display in the graph.
- The Service Graph is available as soon as one or more technical or business services is configured. No further configuration is necessary.
- To configure dependencies in bulk, you can do so via the REST API, Terraform, or by provisioning them from ServiceNow.
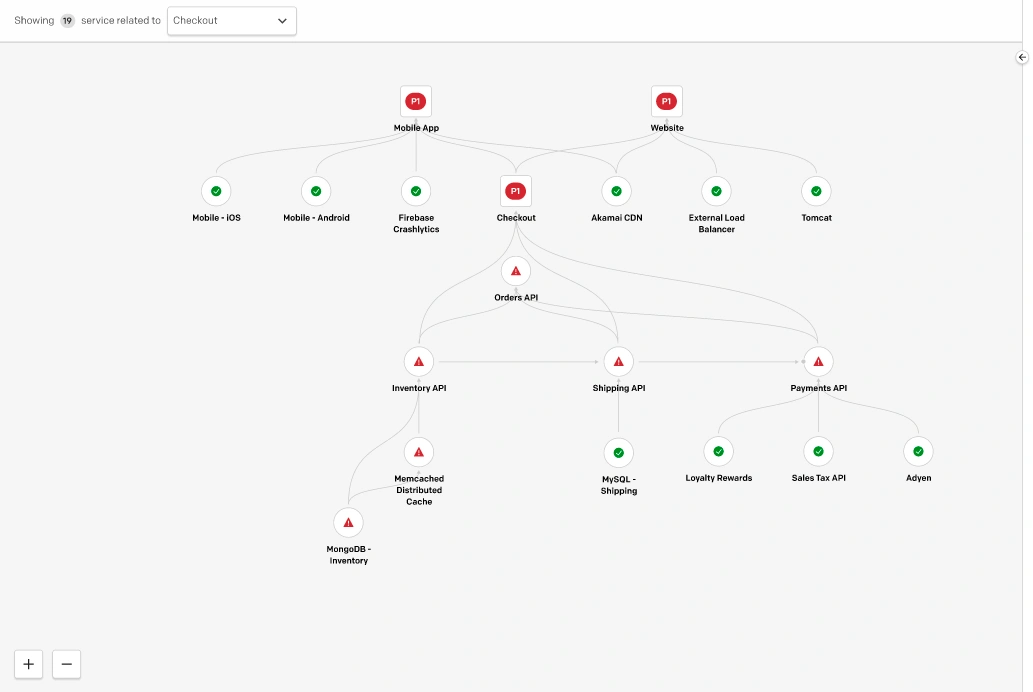
In the PagerDuty web app, navigate to Services Service Graph. The Service Graph displays services that have at least one dependency relationship. Any services that do not yet have dependency relationships are listed in the right panel under Services without Dependencies, which are sorted into two tabs: Technical Services and Business Services.
Service Cards
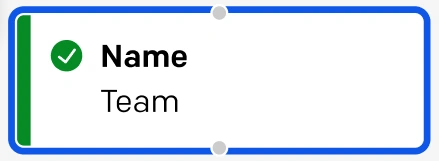
Each service in the graph is represented by a service card. Service cards contain the following critical information about a service:
- Service Name
- Team: Only available on accounts with Teams, and when the view is sufficiently zoomed in.
- Operational Status of the Service: Operational technical services and business services show a green checkmark. Impacted technical services show a red exclamation mark. Impacted business services display the most-impacting incident's Priority.
Service Display Actions
You can zoom in and out, hover, and select to display more or fewer services:
- Zoomed out view: Business services are square and technical services are circular.
- Zoomed in view: Business services are rectangular and technical services have rounded edges.
- Hover: Hovering over a service card highlights the selected service, and one level of relationship from that service in both the Uses and Used By directions.
- Select: Clicking on a service highlights the selected service and one level of relationship from that service in both the Uses and Used By directions. It also displays a right panel with service and incident information.
Right Panel
The information displayed in the right panel includes:
- Service Name
- Service Description
- Status
- On Call Now: Technical services only.
- Escalation Policy: Technical services only.
- Owner: Business services only.
- Team
- Open Incidents: Up to three of the most recent incidents with priority, as applicable. If there are more than three incidents impacting the service, there is also a link to View All Incidents.
- View Service Profile: A link to view the service profile page.
- Manage Service Dependencies: A link to manage dependencies in the service profile page.
Click in the top-right corner of the panel, or on the graph's background, to close the panel.
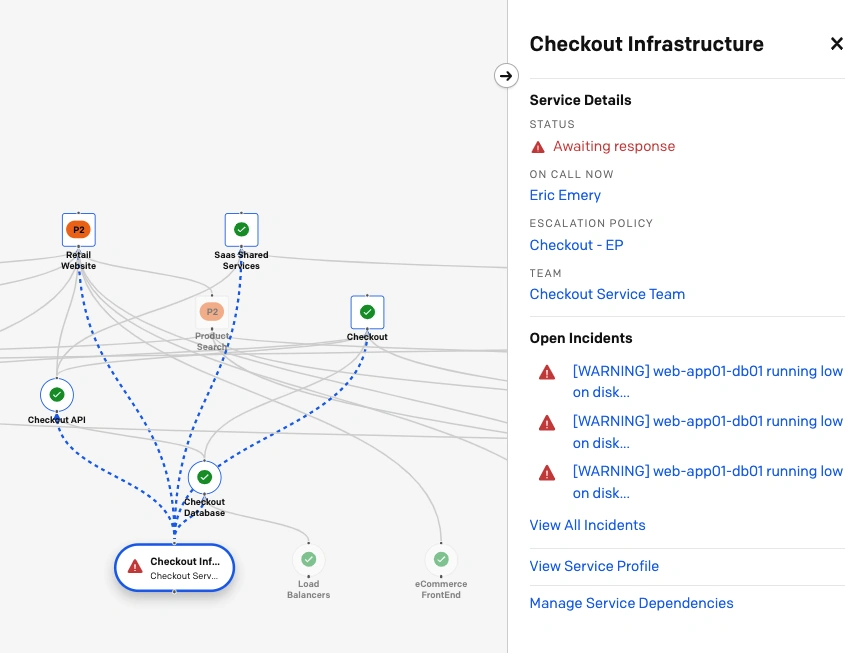
Service details in the right panel
In the cases where there are many relationships or services, the Service Graph displays the top-most or root nodes, and two levels of relationships below that. If there are too many relationships or services to load an optimal view of the Service Graph, you can select a business service or technical service to focus the graph. The filtered view displays the selected service and the two levels of relationships from that service in both the Uses and Used By directions.
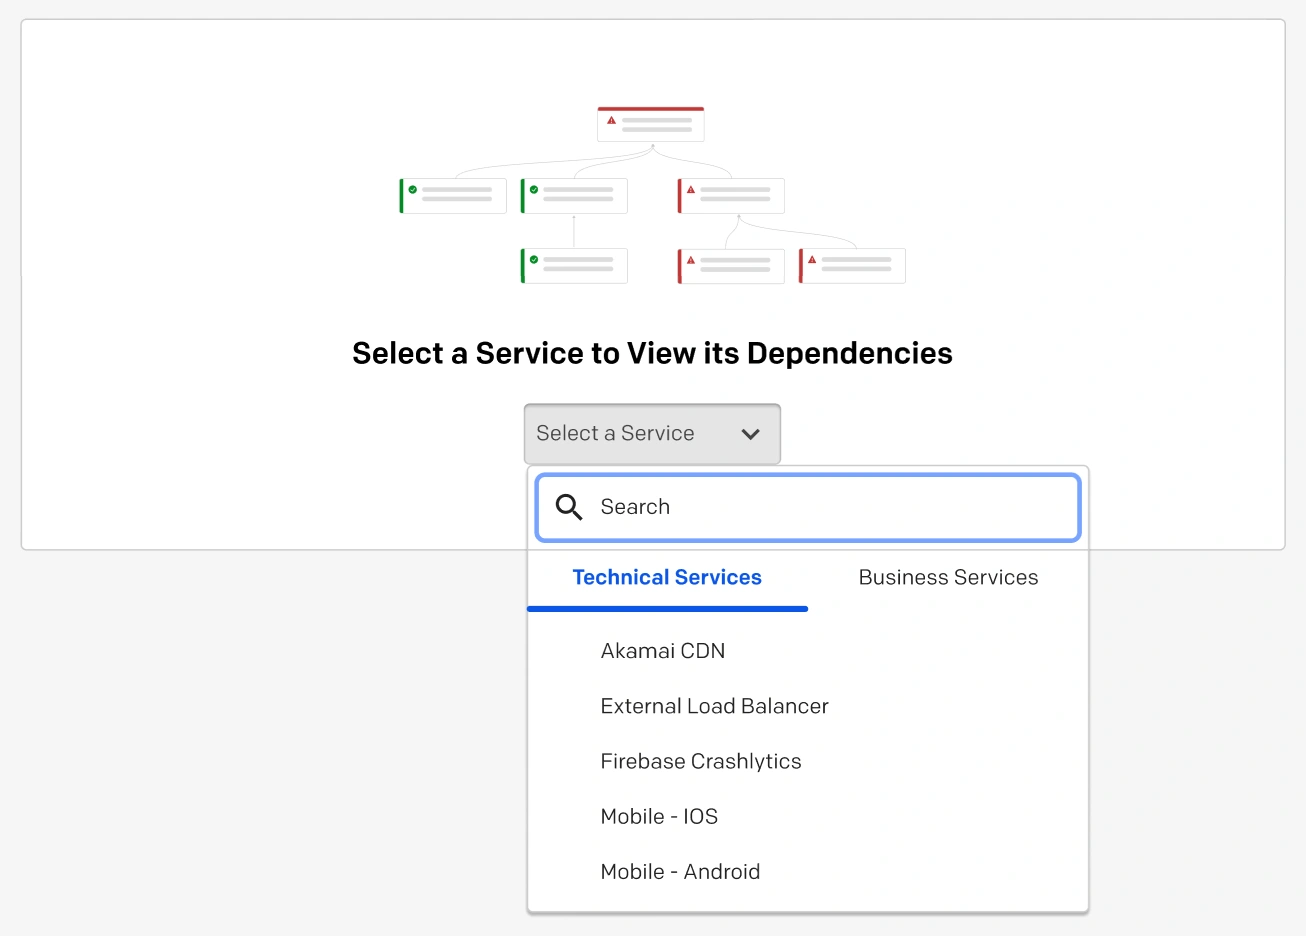
Select a service
Additional service relationships are aggregated into grouped nodes. You can click on a grouped node to expand additional relationships.
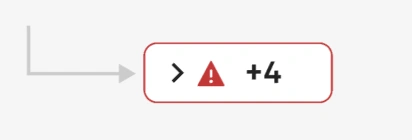
Additional service relationships
Create Service Dependencies
Required User PermissionsIf you have permission to create dependency relationships between services, you can draw connections between nodes in the Service Graph.
- In the PagerDuty web app, navigate to Services Service Graph.
- Search or scroll for your desired technical or business service in the right panel, then drag and drop the service into the Service Graph.
- Hover over a service in the graph to display draggable gray nodes at the top and bottom, which can be used to draw relationships between two services.
- The arrow denotes the direction of the relationship. For example, drawing a line from Service A to Service B denotes that Service B is dependent on Service A.
Service cards with draggable nodes
- Draw an arrow between the services by selecting a node and dragging it in your desired direction to denote the dependency relationship.
Disconnect Dependency Relationships
You can disconnect a relationship in the Service Graph by clicking on the line between two services and selecting Disconnect in the prompt that appears.
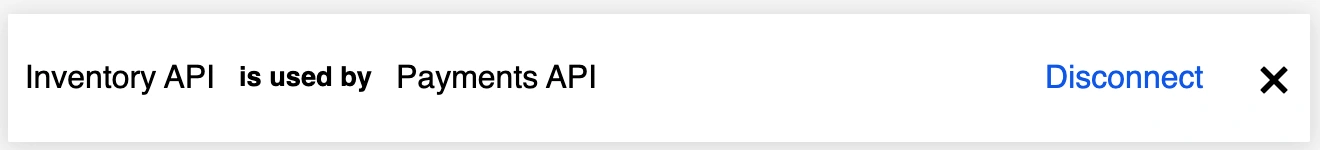
Disconnect dependency relationship
Updated about 2 months ago