
User Onboarding Report
View the status of invited users and their progress
The User Onboarding report displays all user metrics, allowing account administrators to get a full overview of the user licenses in the account, as well as how well-configured users' accounts are.
Required User PermissionsThe Account Owner, Admins, and Managers can view the User Onboarding report. Users without the necessary permissions will not see the User Onboarding report listed in the top navigation bar.
Data Update ScheduleUser Onboarding report data is updated once per day, and it may take up to 24 hours for new data to appear. The report indicates when it was last updated in the upper-right of the page.
View the User Onboarding Report
To view the User Onboarding report in the PagerDuty web app, navigate to Analytics User Onboarding.
Filter and Search
You have the option to filter with the following parameters:
- Team: You can filter by selecting the My Teams tab, All Teams tab or enter a term in the search box to find your preferred Teams. Select the checkbox next to your preferred Team(s) and click Apply.
- Invited Date Range: The date range will automatically default from the date of account creation to the current date. If you would like to change the date range, you may select from Last 7 Days, Last 30 Days, Last Month, This Month, or Custom Range. If you select Custom Range, select the range on the calendar and click Apply.
Note: For custom ranges, you can select a start date up to three years in the past. A maximum duration of one year is allowed.
Summary Metric Cards
Each card shows the percentage and number of users that meet the criteria for the current data to help you measure user onboarding progress.
- Invited versus Joined Utilization: Comparison between users who were invited to PagerDuty versus users who joined (i.e., accepted the invitation).
- % on an Escalation Policy: Percentage of users included in at least one escalation policy.
- % with Notifications Configured: Percentage of users with at least one notification method configured.
- % on Mobile App: Percentage of users with PagerDuty’s mobile app installed.
User List
Below the summary metric cards you will see the User List data specific to the filters you have selected. You may perform the following actions with this table:
- Search: Use the search field to search for specific terms in the table. You can search for a user’s name or email address, a Team, or a specific month or year.
- Sort: Click on a column header to sort results. You can also sort with multiple columns by holding down the shift key while clicking on both of the columns.
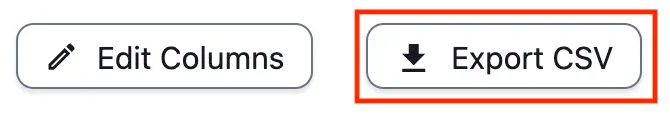
To customize the columns you would like to view, click the Edit Columns button and select your preferred data. The available columns are:
| Column Name | Description |
|---|---|
| User Name | The user’s name (required). |
| Role | The user’s role. |
| The email address associated with the user. | |
| Team | The user’s teams. Only one team name displays at a time while any additional teams are indicated with a number. |
| Date Invited | The date the user was invited to the PagerDuty account. |
| Last Sign In | The most recent date the user signed in to the PagerDuty web app. Excludes mobile app logins. |
| Accepted Invite | Details if the user has signed in to the PagerDuty web app. |
| Notification Methods | Details if the user has notification methods set up. |
| Has Mobile App and Notifications Enabled | Details if the user has installed the mobile app and enabled notifications. |
| On an Escalation Policy | Details if the user is on an escalation policy. |
| On a Schedule | Details if the user is on a schedule. |
NoteThe On an Escalation Policy and On a Schedule columns are marked with a Yes only if the user is a target on an escalation policy or is a member of a schedule’s rotation. Users added to a schedule via an override are marked with a No value.
By default, the User List displays 10 results at a time. Use the dropdown below the table to select from 10, 20, 30, 40 or 50 results per page. If there are more results than the selected dropdown value, you can use the arrows (i.e., , , , ) to navigate through the results.
Share the User Onboarding Report
There are two ways to share the User Onboarding report:
Share Button
Click Share Copy Link to copy the report's unique URL to your clipboard, which you can share with others. Signed-in users who visit the link will see the same filters applied in their report.
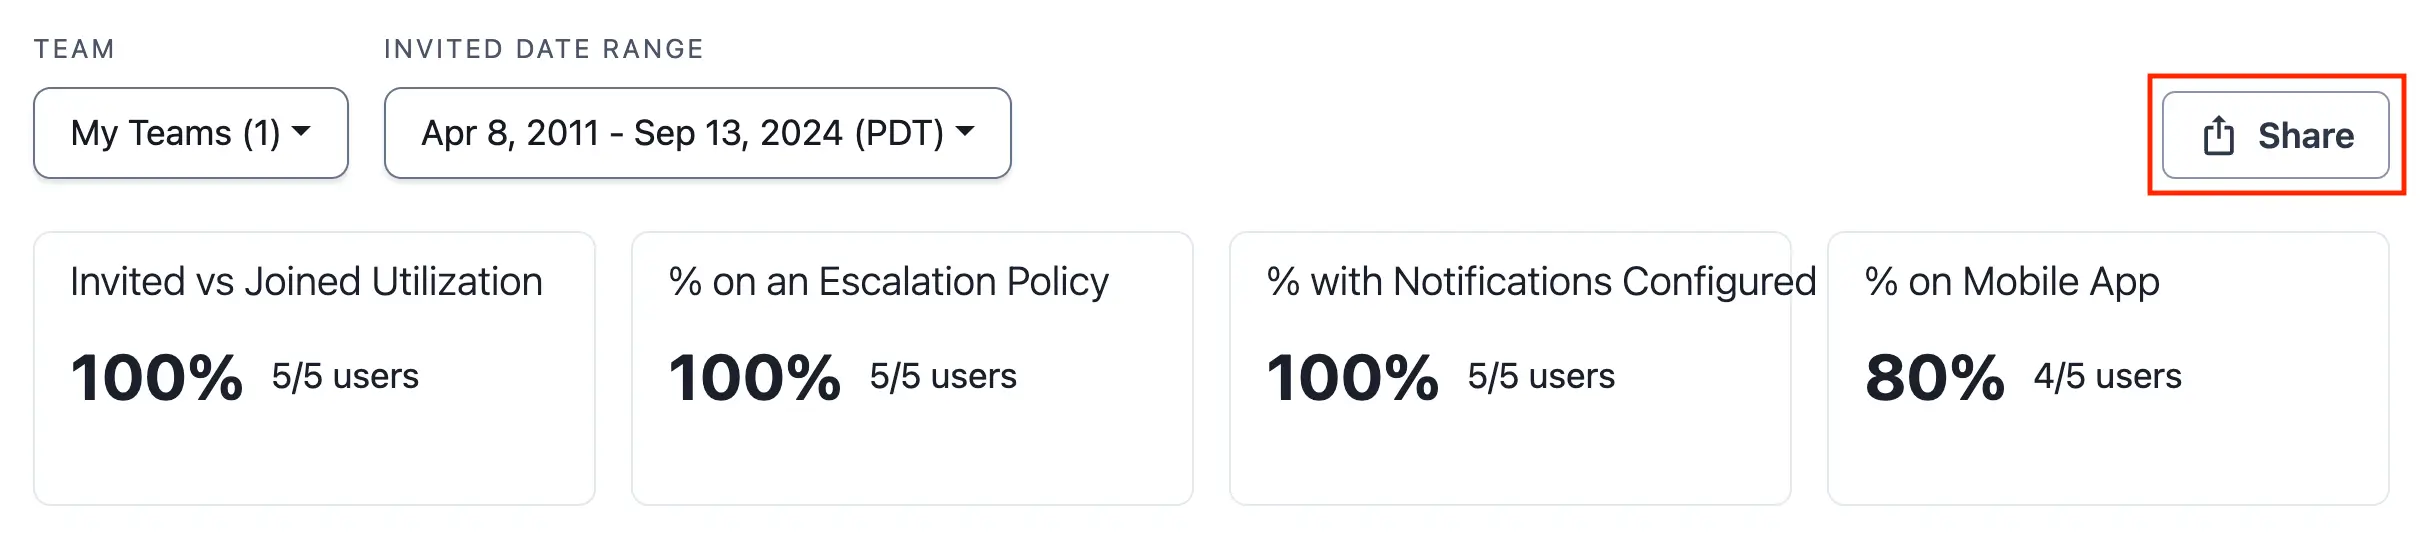
Share the User Onboarding report's URL
Export CSV
To export the User Onboarding report as a .csv file, click Export CSV to generate a file, which will keep the view and results based on your search and filter selections.
Export CSV