
Analytics Dashboard
The Analytics Dashboard provides an account-wide overview of historical data, helping you identify areas for improvement and achieve your digital operations goals.
AvailabilityThe Analytics Dashboard is available on the following pricing plans:
- Professional
- Business
- Enterprise for Incident Management
- Digital Operations (legacy)
Contact the Sales team to upgrade to a plan with this feature.
View the Analytics Dashboard
You can find the Analytics Dashboard in the web app's top navigation bar under Analytics Dashboard. The Analytics Dashboard consists of the following sections:
Data Update ScheduleData in the Analytics Dashboard updates once per day, and it may take up to 24 hours for new data to appear. A timestamp in the page's upper-right indicates the last update.
Filters and Search
The following filters are available to help you find the most relevant results:
- Team: Click the Team dropdown and select the tab for My Teams or All Teams. Select the checkbox next your preferred Team(s) from the list and optionally enter a search term to narrow results. Click Apply to update the data in the Analytics Dashboard.
- Escalation Policy: Click the Escalation Policy dropdown and search or select one or more escalation policies. Click Apply to update the data in the Analytics Dashboard.
- Note: If you have filtered by specific Teams, this filter automatically populates the escalation policies associated with the selected Team(s).
- Service: Click the Service dropdown and search or select one or more services. Click Apply to update the data in the Analytics Dashboard.
- Note: If you have filtered by specific services, this filter automatically populates services associated with the selected Team(s).
- Urgency: Select from All, High, or Low to display incidents with the chosen urgency.
- Priority: Select from All or any of your account's preconfigured Incident Priority level(s).
- Date Range: Select from Last 7 Days, Last 30 Days, Last Month, This Month, or Custom Range (if you select Custom Range, use the calendar to choose your preferred start and end dates and click Apply).
- Note: For custom ranges, you can select a start date up to three years in the past. A maximum duration of one year is allowed.
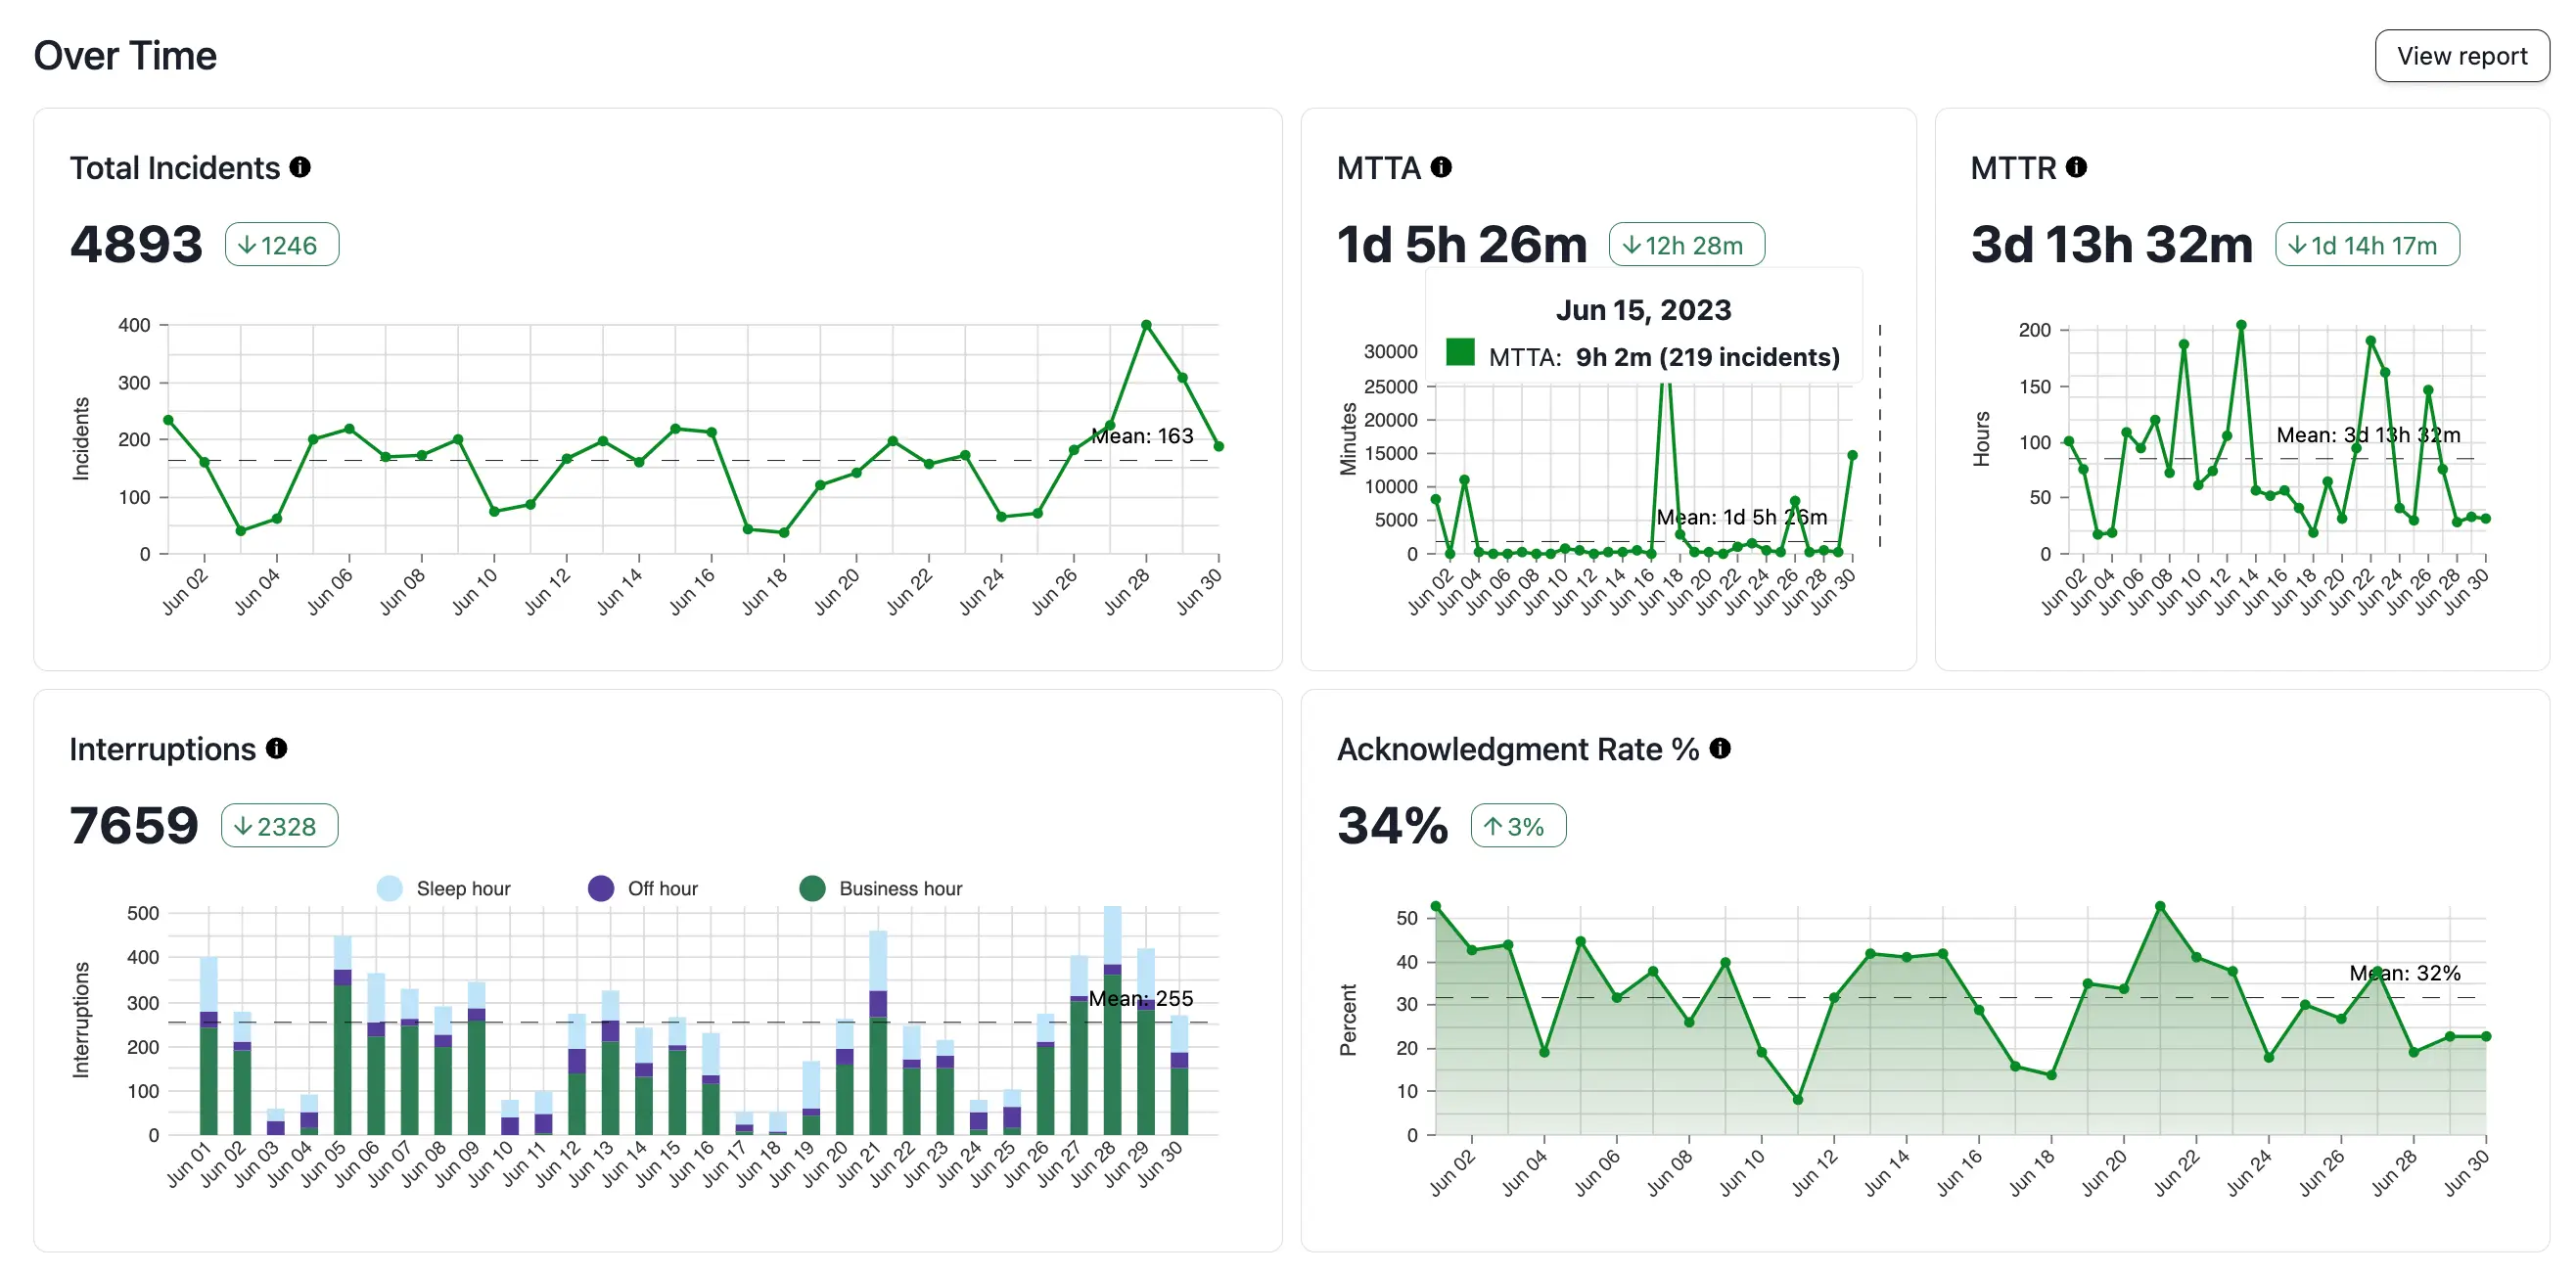
Over Time
The Over Time section offers a visualization of key incident metrics: Total Incidents, MTTA, MTTR, Interruptions, and Acknowledgement Rate %.
Over Time analytics
| Metric | Definition |
|---|---|
| Total Incidents | Total count of incidents matching the active filters. |
| MTTA | Mean time to acknowledge is the average amount of time from when an incident is created until the time the first responder acknowledges an incident. Excludes incidents that were not acknowledged. |
| MTTR | Mean time to resolve is the average amount of time from when an incident was created until it was resolved. Excludes incidents that have not been resolved. |
| Interruptions | Interruptions are when an on-call responder receives a mobile push, phone call notification, or SMS (text). Notifications sent from various channels (push, phone, SMS) to the same user count as one interruption. |
| Acknowledgement Rate % | Percentage of the total number of incidents which were acknowledged. Only explicit incident acknowledgments count; reassign, resolve, and escalation actions do not imply acknowledgement. |
Click View Report in this section to see the Incident Activity report.
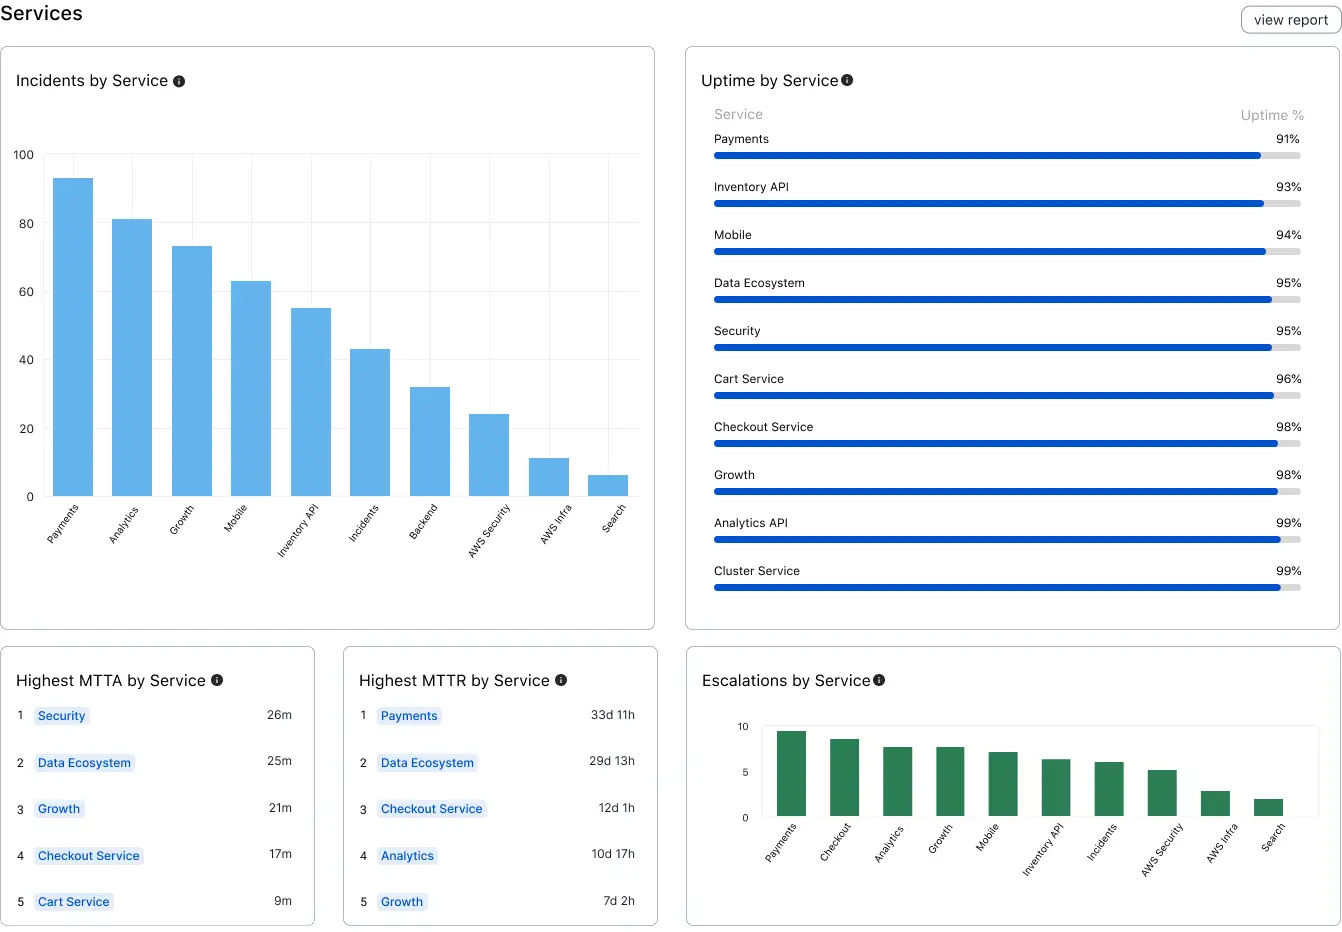
Services
The Services section offers a visualization of key metrics, sorted by services, such as the Incidents by Service, Uptime, Highest MTTA, Highest MTTR, and Escalations by Service.
Service analytics
| Metric | Definition |
|---|---|
| Incidents by Service | Total count of incidents matching the provided filters, sorted by service. |
| Uptime by Service | The inverse of the time (in %) during which the service had an active major incident, sorted by service. A major incident is defined as the top two levels of your priority settings, or if multiple responders are added and acknowledge. |
| Highest MTTA by Service | Highest mean time to acknowledge matching the provided filters, sorted by Services. MTTA is the average amount of time from when an incident is created until the time the first responder acknowledges an incident. Excludes incidents that were not acknowledged. |
| Highest MTTR by Service | Highest mean time to resolve matching the provided filters, sorted by Services. MTTR is the average amount of time from when an incident was created until it was resolved. Excludes incidents that have not been resolved. |
| Escalations by Service | Total count of escalations that occurred for incidents on this service. |
Click View Report in this section to see the Service Performance report.
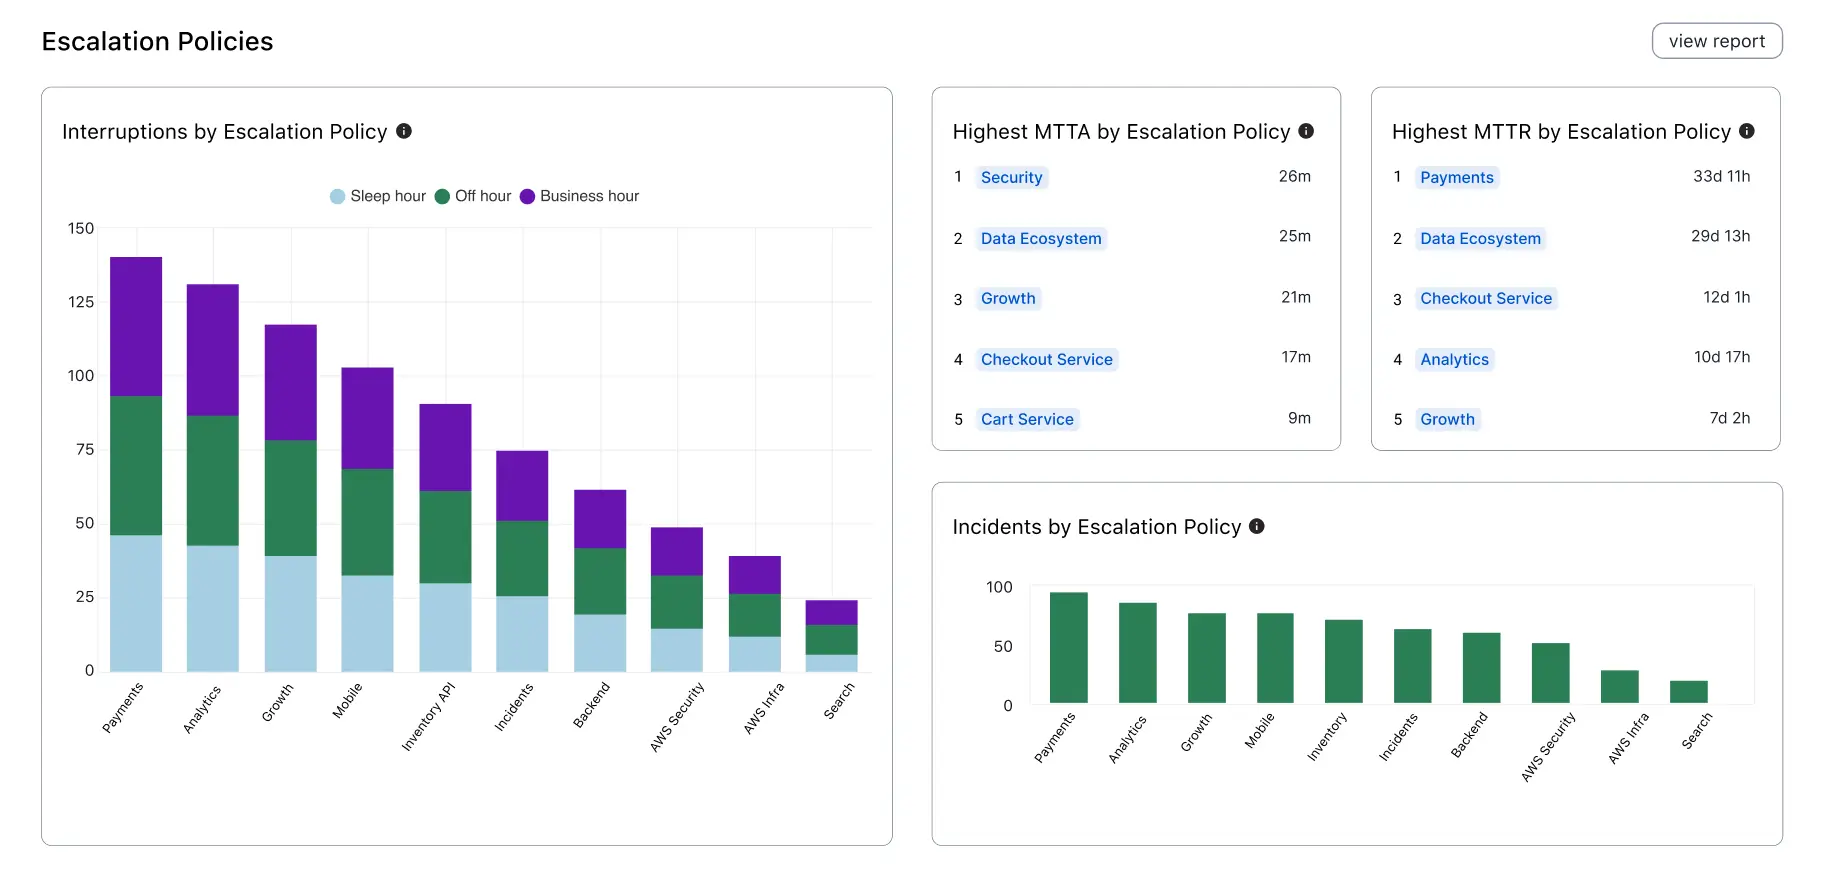
Escalation Policies
The Escalation Policies section offers a visualization of key metrics, sorted by escalation policies, such as Interruptions, Highest MTTA, Highest MTTR, and Incidents by Escalation Policy.
Escalation Policy analytics
| Metric | Definition |
|---|---|
| Interruptions by Escalation Policy | Total count of interruptions, sorted by Escalation Policies. Interruptions are when an on-call responder receives a mobile push, phone call, or SMS (text). Notifications sent from various channels (push, phone, SMS) to the same user count as one interruption. |
| Highest MTTA by Escalation Policy | Highest mean time to acknowledge matching the provided filters, sorted by Escalation Policies. MTTA is the average amount of time from when an incident is created until the time the first responder acknowledges an incident. Excludes incidents that were not acknowledged. |
| Highest MTTR by Escalation Policy | Highest mean time to resolve matching the provided filters, sorted by escalation policy. MTTR is the average amount of time from when an incident was created until it was resolved. Excludes incidents that have not been resolved. |
| Incidents by Escalation Policy | Total count of incidents matching the active filters, sorted by escalation policy. |
Click View Report in this section to see the Escalation Policy report.
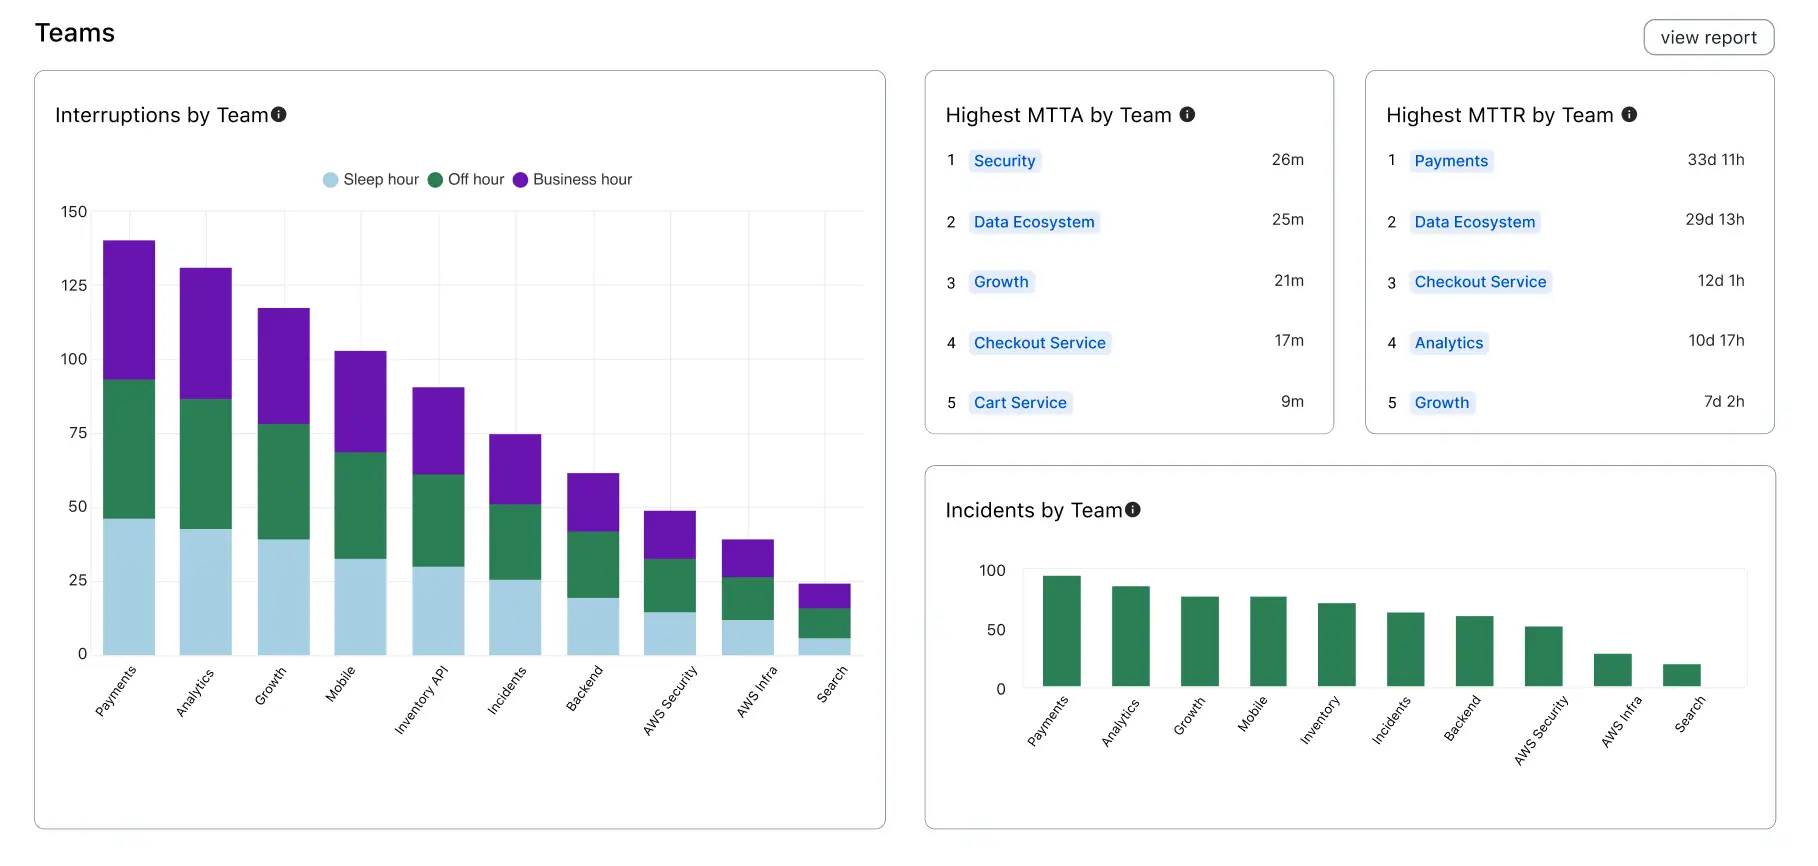
Teams
The Teams section offers a visualization of key metrics, sorted by Teams, such as the Interruptions, Highest MTTA, Highest MTTR, and Incidents by Team.
Team analytics
| Metric | Definition |
|---|---|
| Interruptions by Team | Total count of interruptions, sorted by Teams. Interruptions are when an on-call responder receives a mobile push, phone call, or SMS (text) notification. Notifications sent from various channels (push, phone, SMS) to the same user count as one interruption. |
| Highest MTTA by Team | Highest mean time to acknowledge matching the provided filters, sorted by Teams. MTTA is the average amount of time from when an incident is created until the time the first responder acknowledges an incident. Excludes incidents that were not acknowledged. |
| Highest MTTR by Team | Highest mean time to resolve matching the provided filters, sorted by Teams. MTTR is the average amount of time from when an incident was created until it was resolved. Excludes incidents that have not been resolved. |
| Incidents by Team | Total count of incidents matching the active filters, sorted by Teams. |
Click View Report in this section to see the Team report.
Responders
The Responders section offers a visualization of key metrics, sorted by responders, such as the Response Effort and Incidents by Responder.
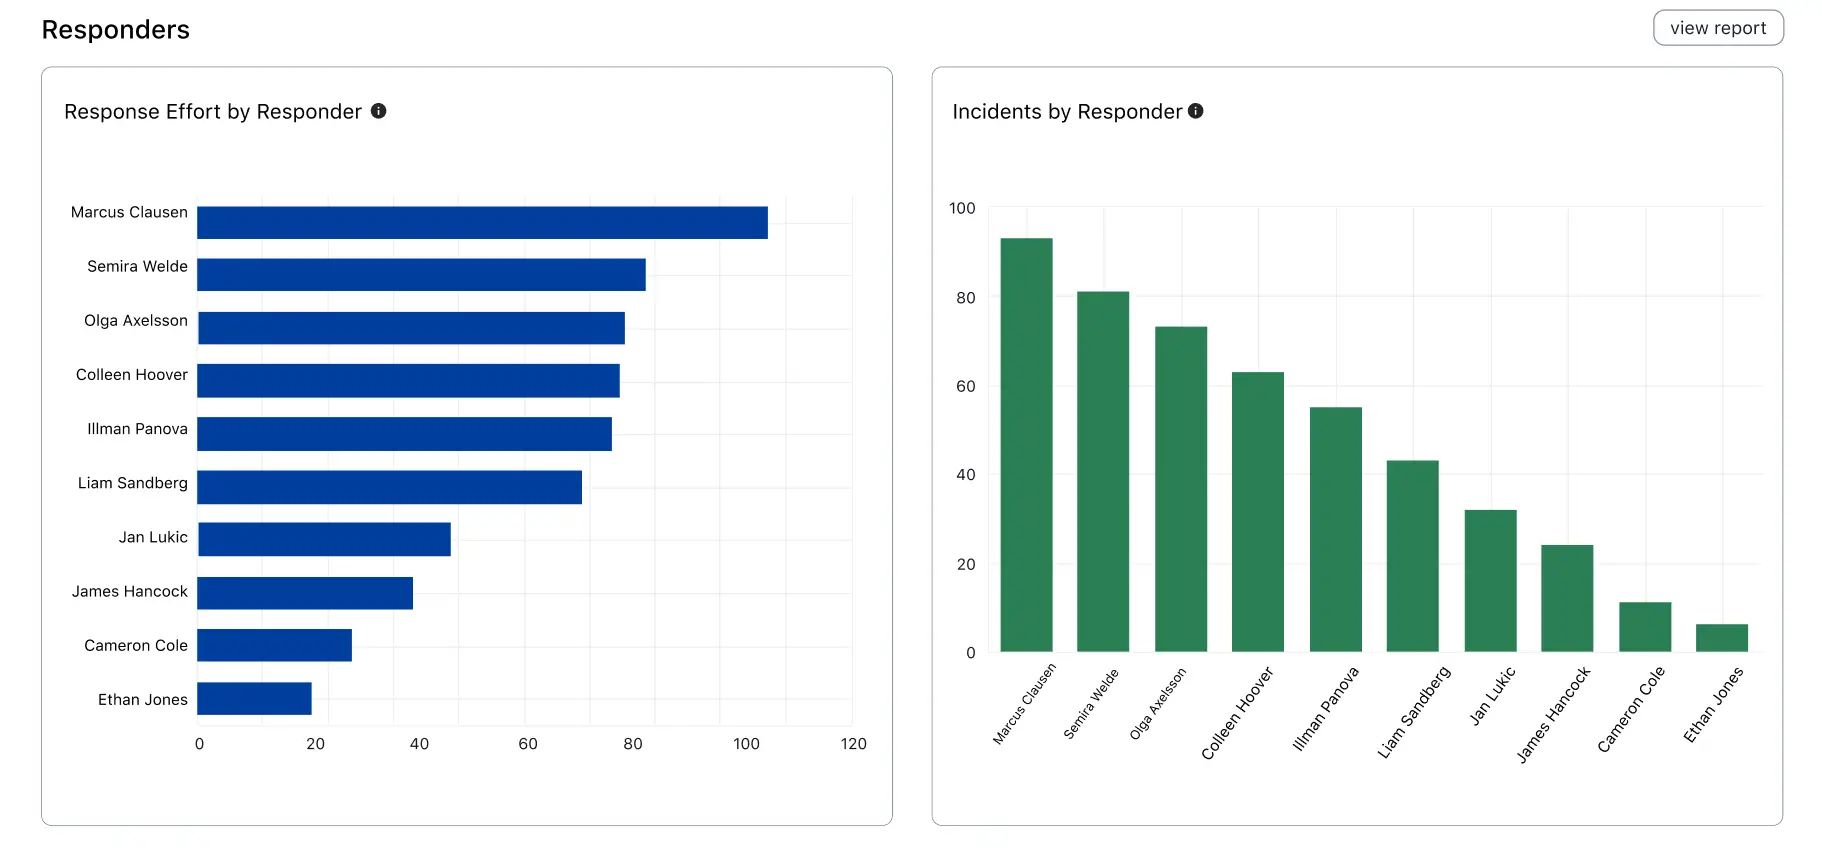
Responder analytics
| Metric | Definition |
|---|---|
| Response Effort by Responder | The total engaged time of the responder, measured from the time the responder acknowledges or accepts a responder request, until the incident is resolved. |
| Incidents by Responder | Total count of incidents matching the active filters, sorted by responders. |
Click View Report in this section to see the Responder report.
Share the Analytics Dashboard
Click Share Copy Link to copy the dashboard's unique URL to your clipboard, which you can share with others. Signed-in users who visit the link see the same filters applied in their dashboard.
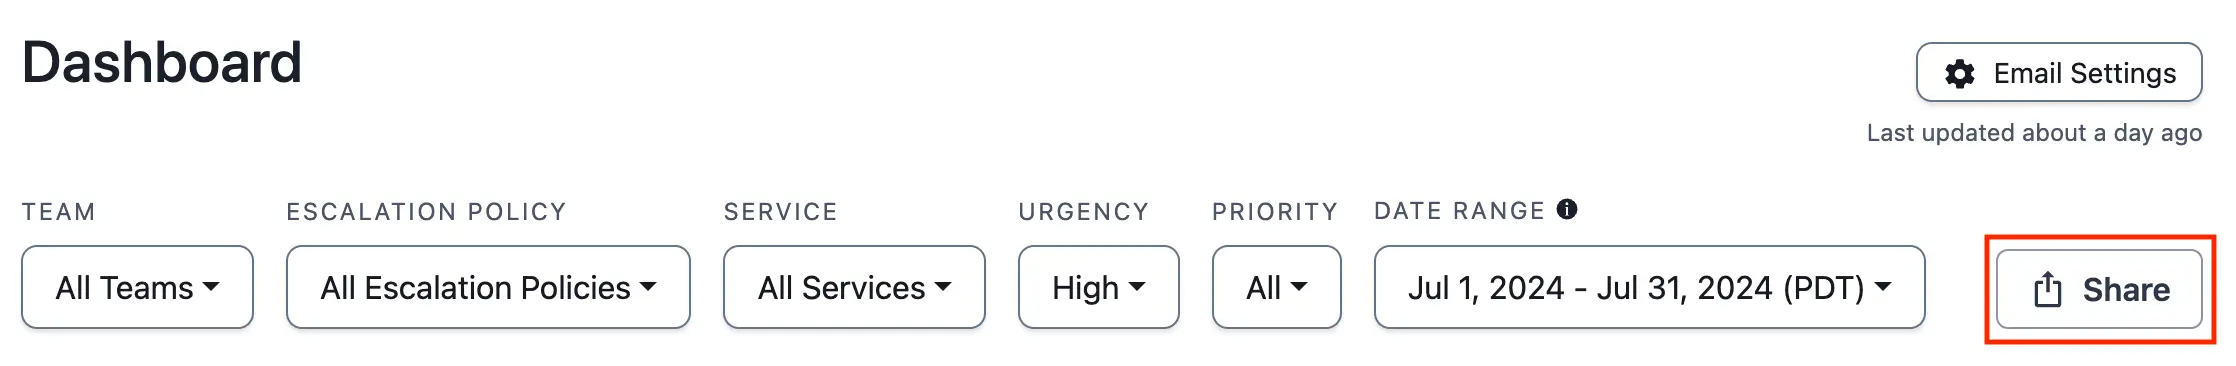
Share a dashboard's URL
Updated about 1 month ago