PD Labs
View operational maturity insights and recommendations
PD Labs allows you to explore and test drive new products from PagerDuty Analytics. Surface insights on your organization’s operational maturity and receive recommendations on how to improve, with push-button account configuration options.
Beta
PD Labs is available as part of a private beta for customers on our Digital Operations plan or for customers who have purchased the PagerDuty Analytics product. Please contact our Sales Team if you would like to upgrade to a plan with this feature. PD Labs features and documentation are subject to change.
Required User Permissions
All users, with the exception of Limited Stakeholders, can access PD Labs.
Insights
Insights is a reporting tool which provides you with flexible data tables to help you find answers to common questions about your incident activity, service serformance, responders, Teams and business impact. You can search, filter, and sort data by Team, Urgency, Priority, Date Range, as well as a number of other fields in order to view data in a way that is most useful to you.
Insights can be found by navigating to Analytics Insights.
Data Updates
Insights data is updated once per day, and it takes up to 24 hours for new data to appear. Each report has a date and timestamp of when it was last updated in the upper right of the page.
Incident Activity
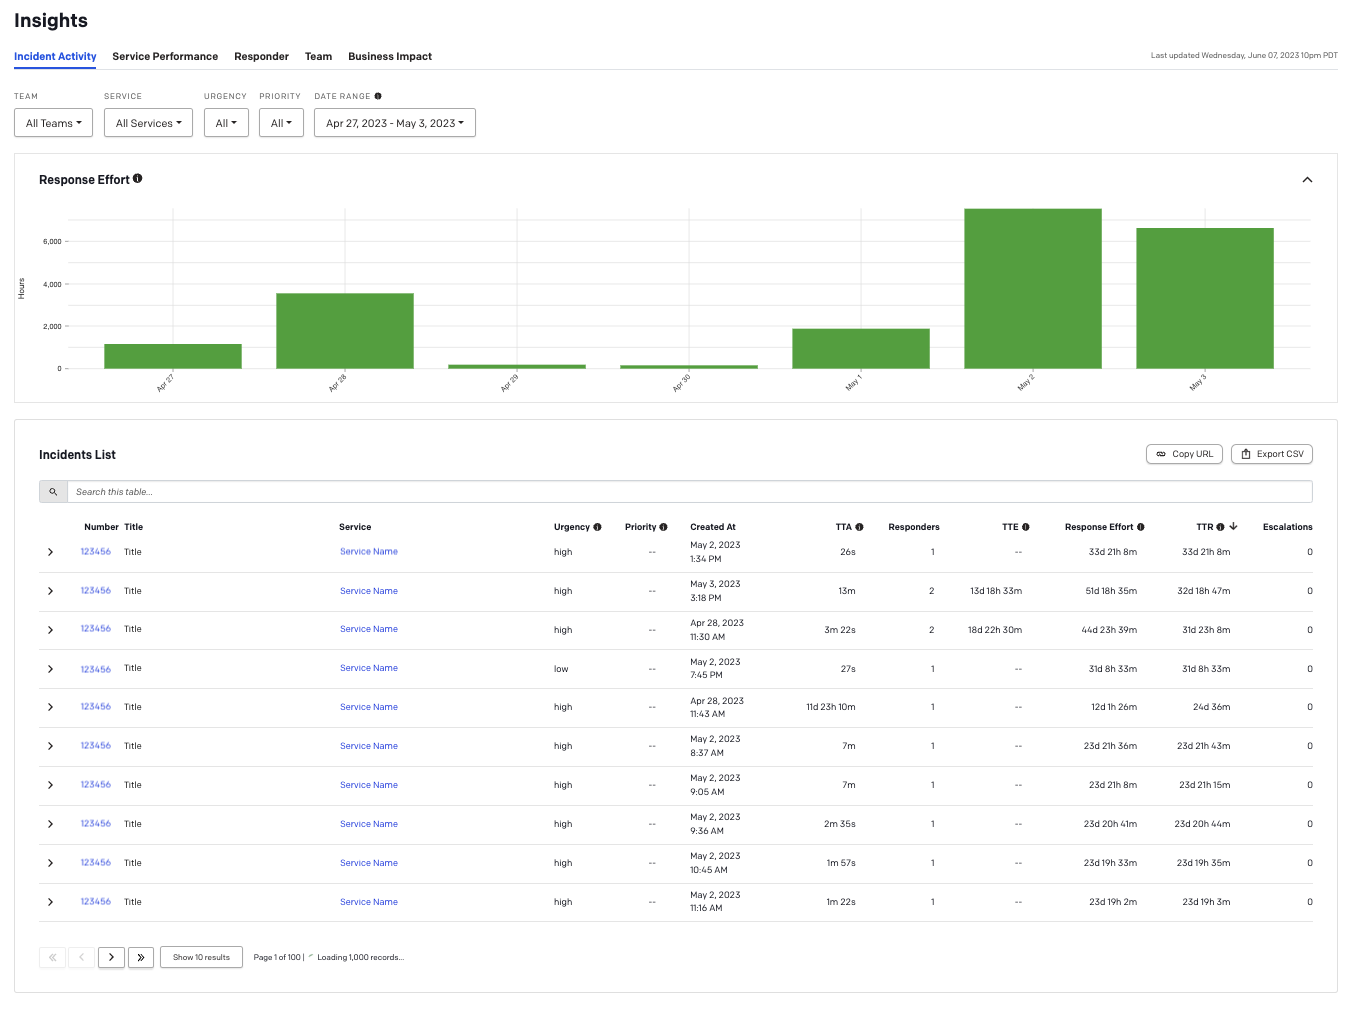
The Incident Activity report offers a visualization of response effort over time. It also includes an Incidents List with metrics including total time to acknowledge (TTA), responder count, total time to engage (TTE), response effort, total time to respond (TTR), and escalation count.
To view the Incident Activity report, navigate to Analytics Insights Incident Activity tab.
Incident Activity Report
Filter and Search Incident Activity
You have the option to filter with the following parameters:
- Team: You can filter by selecting the My Teams tab, All Teams tab or enter a term in the search box to find your preferred Teams. Select the checkbox next to your preferred Team(s) and click Apply.
- Service: You may select specific services and click Apply, or Select All services. Note: If you select a list of Teams (above), you will only be able to select services related to those Teams.
- Urgency: Select from All, High or Low to display incidents with the chosen urgency.
- Priority: Select from All or any of your account’s preconfigured priority levels.
- Date Range: Select from Last 7 Days, Last 30 Days, Last Month, This Month, or Custom Range. If you select Custom Range, select the range on the calendar and click Apply. Note: For custom ranges, you can select a start date up to three years in the past.
Data Visualizations
Once you have set your preferred filters, you will see the Response Effort data visualization representing the filters and date range specified. Response Effort is defined as the total engaged time across all responders, measured from the time a responder acknowledges or accepts a responder request until the incident is resolved.
Incidents List
Below the data visualization you will see the Incidents List data specific to the filters you have selected. You may perform the following actions with this table:
- Search: Use the search field to search for specific data.
- Sort: Click on a column header to sort results. You can also sort with multiple columns by holding down the shift key while clicking on both of the columns. The graph above will not change if you sort the data.
- Drill Down: Click to the left of an incident number to drill down into responder details such as responder status, type of assignment, request and response timestamps, and time to respond. Click an incident number or service name in the Number and Service columns to view more information about those incidents or services.
The available Incidents List columns are:
- Number: The incident number.
- Title: The incident title.
- Service: The service where the incident was triggered.
- Urgency: The urgency level of the incident.
- Priority: The priority level of the incident.
- Created at: The date and timestamp of when the incident was triggered.
- TTA (Time to Acknowledge): The amount of time between incident creation and the when first responder acknowledged the incident.
- Responders: The total count of responders assigned to the incident.
- TTE (Time to Engage): The time from first responder engagement to last responder engagement.
- Response Effort: The total engaged time across all responders, measured from the time a responder acknowledges or accepts a responder request until the incident is resolved.
- TTR (Time to Resolve): The time from incident creation to when it was resolved.
- Escalations: The total count of escalations.
By default, 10 results are shown at a time. Click the Show [x] results dropdown to select from 10, 20, 30, 40 or 50 results per page.
Share the Incident Activity Report
Please read Share a Report for more information on sharing or exporting the report.
Service Performance
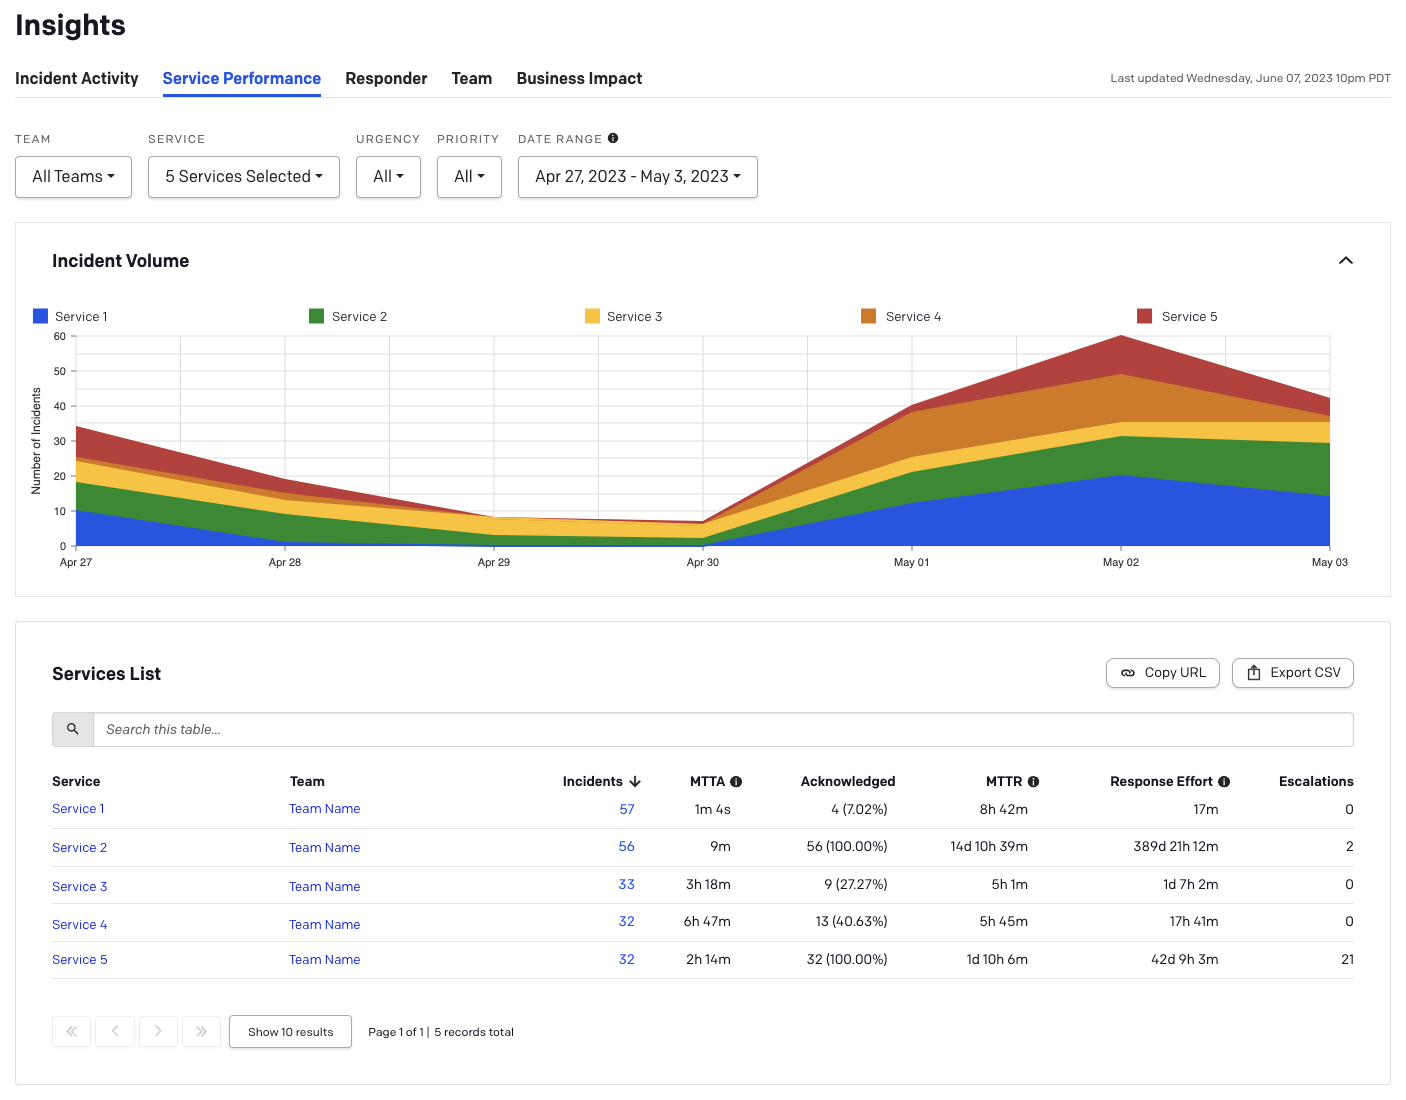
The Service Performance Report offers a visualization of incident volume by service. It also includes a Services List with metrics including incident count, mean time to acknowledge (MTTA), acknowledgement rate, mean time to resolve (MTTR), response effort (incident duration), and escalation count.
To view the Service Performance report, navigate to Analytics Insights Service Performance tab.
Service Performance Report
Filter and Search Service Performance
Tip
You can view up to ten services in the data visualization. If you select more than ten services, the extra services will be collapsed into a single +n more line with a corresponding legend.
If a selected service does not have any incidents in the selected date range, it will not appear in the data visualization or in the Services List.
You may optionally filter with the following parameters:
- Team: Select the My Teams or All Teams tab, or search for your preferred Teams. Select each preferred Team’s checkbox and click Apply.
- Service: You may search and/or select specific services, or Select All services and then click Apply. Note: If you have filtered by specific Teams (above), this filter will automatically be populated with the services owned by the Team(s) you have selected.
- Urgency: Select from All, High or Low urgency incidents.
- Priority: Select from specific priority levels or All of your account’s preconfigured priority levels.
- Date Range: Select from Last 7 Days, Last 30 Days, Last Month, This Month, or Custom Range. If you select Custom Range, select the range on the calendar and click Apply.
- Note: For custom ranges, you can select dates up to three years in the past.
- Graph Legend: In the graph legend, you can click a service name to show or hide the service within the graph. The scale of the graph will automatically adjust as services are added and removed.
Data Visualizations
Once you have set your preferred filters, you will see the Incident Volume data visualization representing the filters and date range specified. The Incident Volume data visualization displays a stacked graph of incidents over time, per service.
Services List
Below the data visualization you will see the Services List data specific to the filters you have selected. You may perform the following actions with this table:
- Search: Use the search field to search for specific data.
- Sort: Click on a column header to sort results. You can also sort with multiple columns by holding down the shift key while clicking on both of the columns. The graph above will not change if you sort the data.
- Drill Down: Click a service, Team or incident count in the Service, Team or Incidents columns to view more information about each.
Service Display Order
Services with data that match the given filters and date range are shown, and they are sorted by the count of incidents each service has had. If a service does not have any data that matches the filters within the given date range, they will not appear in the Services List.
The available Services List columns are:
- Service: The service name.
- Team: The Team each service belongs to. Teams allow users to group and control user access to associated PagerDuty objects, such as escalation policies, users, schedules and services.
- Incidents: The total count of incidents that occurred on the service within the specified time period.
- Acknowledged: The percentage and the total number of incidents that were acknowledged on the service. Only explicit incident acknowledgment counts; reassign, resolve, and escalation actions do not imply acknowledgement.
- MTTR (Mean time to Resolve): The average time from when an incident was created until it was resolved.
- Response Effort: The total engaged time across all responders, measured from the time a responder acknowledges or accepts a responder request until the incident is resolved.
- Escalations: The total count of escalations per service.
By default, 10 results are shown at a time. Click the Show [x] results dropdown to select from 10, 20, 30, 40 or 50 results per page.
Share the Service Performance Report
Please read Share a Report for more information on sharing or exporting the report.
Responder
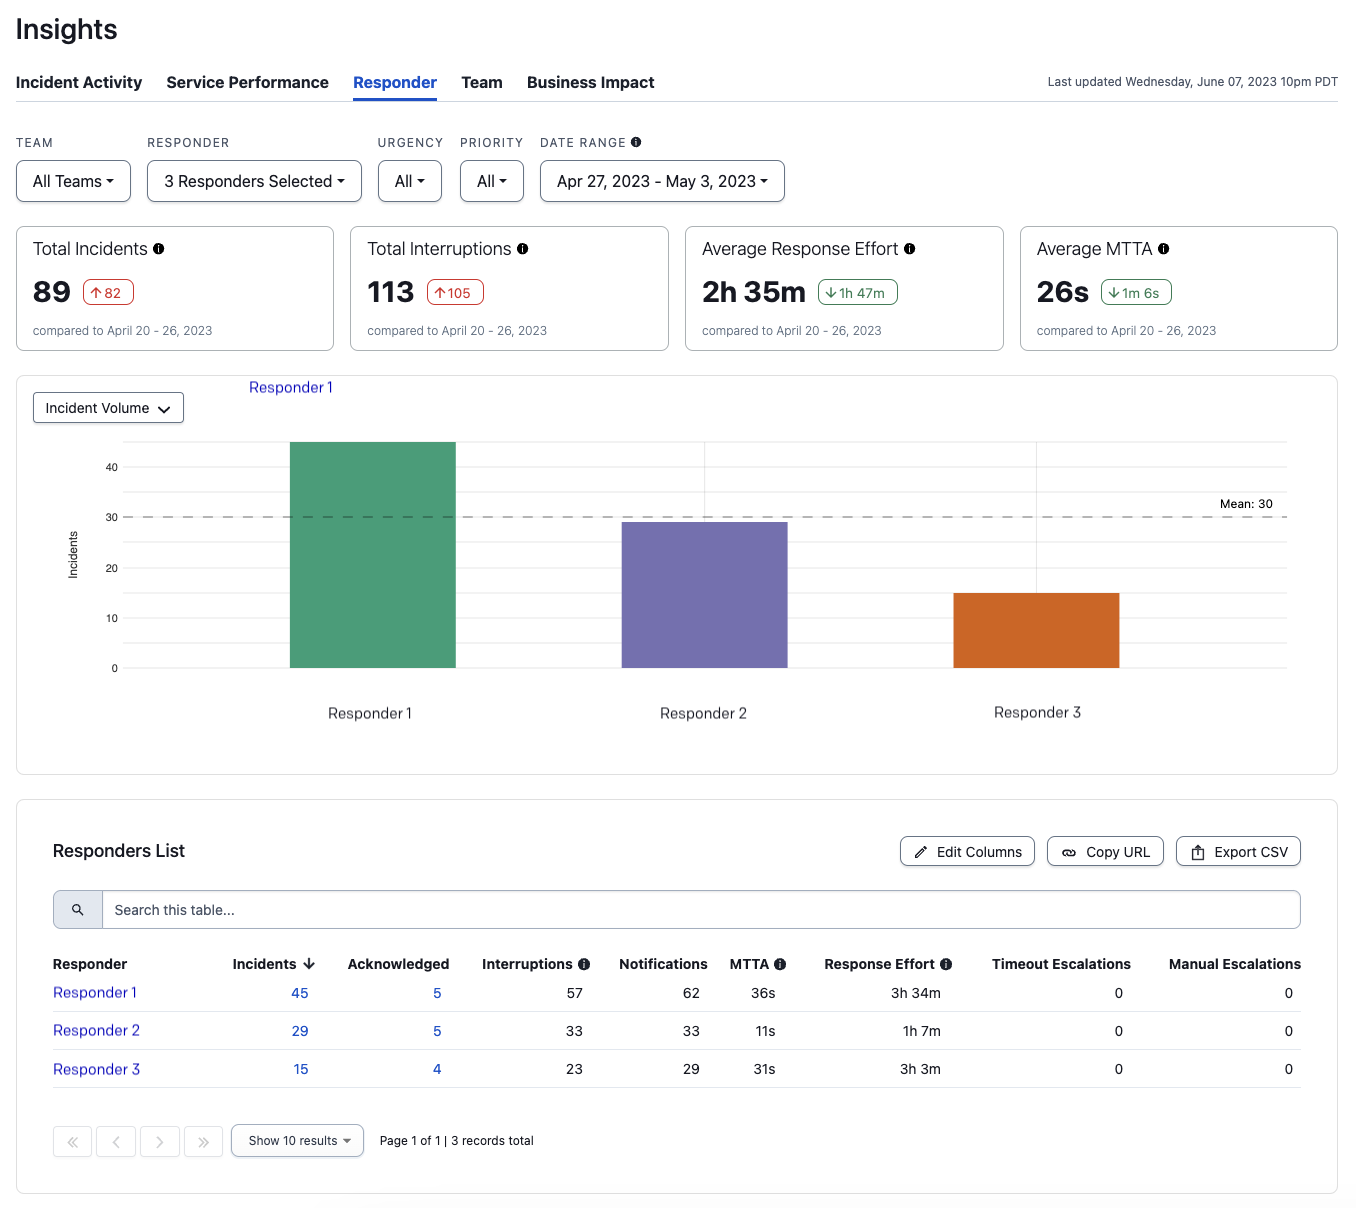
The Responder report provides insights into incident impact on individual responders. It also includes a Responders List with metrics such as interruptions count, mean time to acknowledge (MTTA) and response effort (incident duration).
To view the Responder report, navigate to Analytics Insights Responder tab.
Responder Report
Filter and Search the Responder Report
You have the option to filter with the following parameters:
- Team: You can filter by selecting the My Teams tab, All Teams tab or enter a Team name in the search box to search and select your preferred Team(s). Select the checkbox to the left of your preferred Team(s) and click Apply.
- Responder: Check the checkbox to the left of each responder to select individuals, or click Select All to select all responders. You may also enter a responder’s name in the search box to search and select a responder. Once you have made your selections, click Apply.
- Urgency: Select from All, High or Low to display incidents with the chosen urgency.
- Priority: Select from All or any of your account’s preconfigured priority levels.
- Date Range: Select from Last 7 Days, Last 30 Days, Last Month, This Month, or Custom Range. If you select Custom Range, select the range on the calendar and click Apply. Note: For custom ranges, you can select a start date up to three years in the past.
Summary Metric Cards
- Total Incident Volume: The total count of incidents that all selected responders were engaged in across the specified date range.
- Total Interruption Volume: The total count of interruptions for all selected responders that occurred across the specified date range. Interruptions are when a responder receives an SMS (text), mobile push, or phone call notification. Notifications sent from various channels (SMS, push, phone) to the same destination are counted as one interruption.
- Average Response Effort: The average engaged time across selected responders during the specified date range. Response effort is measured from the time a responder acknowledges or accepts a responder request until the incident is resolved.
- Average MTTA: The average Mean Time to Acknowledge of all selected responders across the specified date range.
Each card includes a comparison time period. For example, if your selected time period is the last week, the cards will show you the change in each metric compared to the week prior.
Data Visualizations
You can change the dropdown at the top left to select one of four visualizations:
- Incident Volume: Number of incidents per responder
- Interruption Volume: Number of interruptions per responder
- Response Effort: Number of hours per responder
- MTTA: Mean time to acknowledge in seconds per responder
Responders List
Below the data visualization you will see the Responders List data specific to the filters you have selected. You may perform the following actions with this table:
- Search: Use the search field to search for specific data.
- Sort: Click on a column header to sort results. You can also sort with multiple columns by holding down the shift key while clicking on both of the columns. The graph above will not change if you sort the data.
- Drill Down: Click a responder, incident count or acknowledged count in the Responder, Incidents or Acknowledged columns to view more information about each.
To customize the columns you would like to view, click the Edit Columns button and select your preferred data. The available columns are:
- Team: The Team each responder belongs to. Teams allow users to group and control user access to associated PagerDuty objects, such as escalation policies, users, schedules and services.
- Incidents: The total count of incidents that the responder was assigned to within the specified time period.
- Acknowledged: The total count of assigned incidents acknowledged by the user. Only explicit incident acknowledgment counts; reassign, resolve, and escalation actions do not imply acknowledgement.
- Interruptions: The total count of incidents that interrupted during off and sleep hours (defined in Off and Sleep Hours Interruptions below) in responders’ local time.
- Business Hour Interruptions: The total count of incidents that occurred between business hours. Business hours are defined as the time between 8am and 6pm everyday, based on the local time set on an account.
- Off Hour Interruptions: The total count of incidents that occurred between off hours. Off hours are defined as the time between 6pm and 10pm weekdays and all day weekends, based on the local time set on an account.
- Sleep Hour Interruptions: The total count of incidents that occurred between sleep hours. Sleep hours are defined as the time between 10pm and 8am everyday, based on the local time set on an account.
- Notifications: The total count of incident notifications sent via email, SMS, phone call and push.
- MTTA (Mean time to Acknowledge): The average time between when an incident is first assigned to a user and when the incident is first acknowledged by that user. Reassign, resolve, and escalation actions do not imply acknowledgement.
- Response Effort: The total engaged time across all responders, measured from the time a responder acknowledges or accepts a responder request until the incident is resolved.
- Timeout Escalations: The total count of the user’s assigned incidents that were escalated due to timeouts.
- Manual Escalations: The total count of the user’s assigned incidents that were manually escalated away from a user without acknowledgement.
- Reassignments: The total count of a user’s assigned incidents that were manually reassigned to a user who is not on the original escalation policy, or to another escalation policy.
By default, 10 results are shown at a time. Click the Show [x] results dropdown to select from 10, 20, 30, 40 or 50 results per page.
Share the Responder Report
Please read Share a Report for more information on sharing or exporting the report.
Team
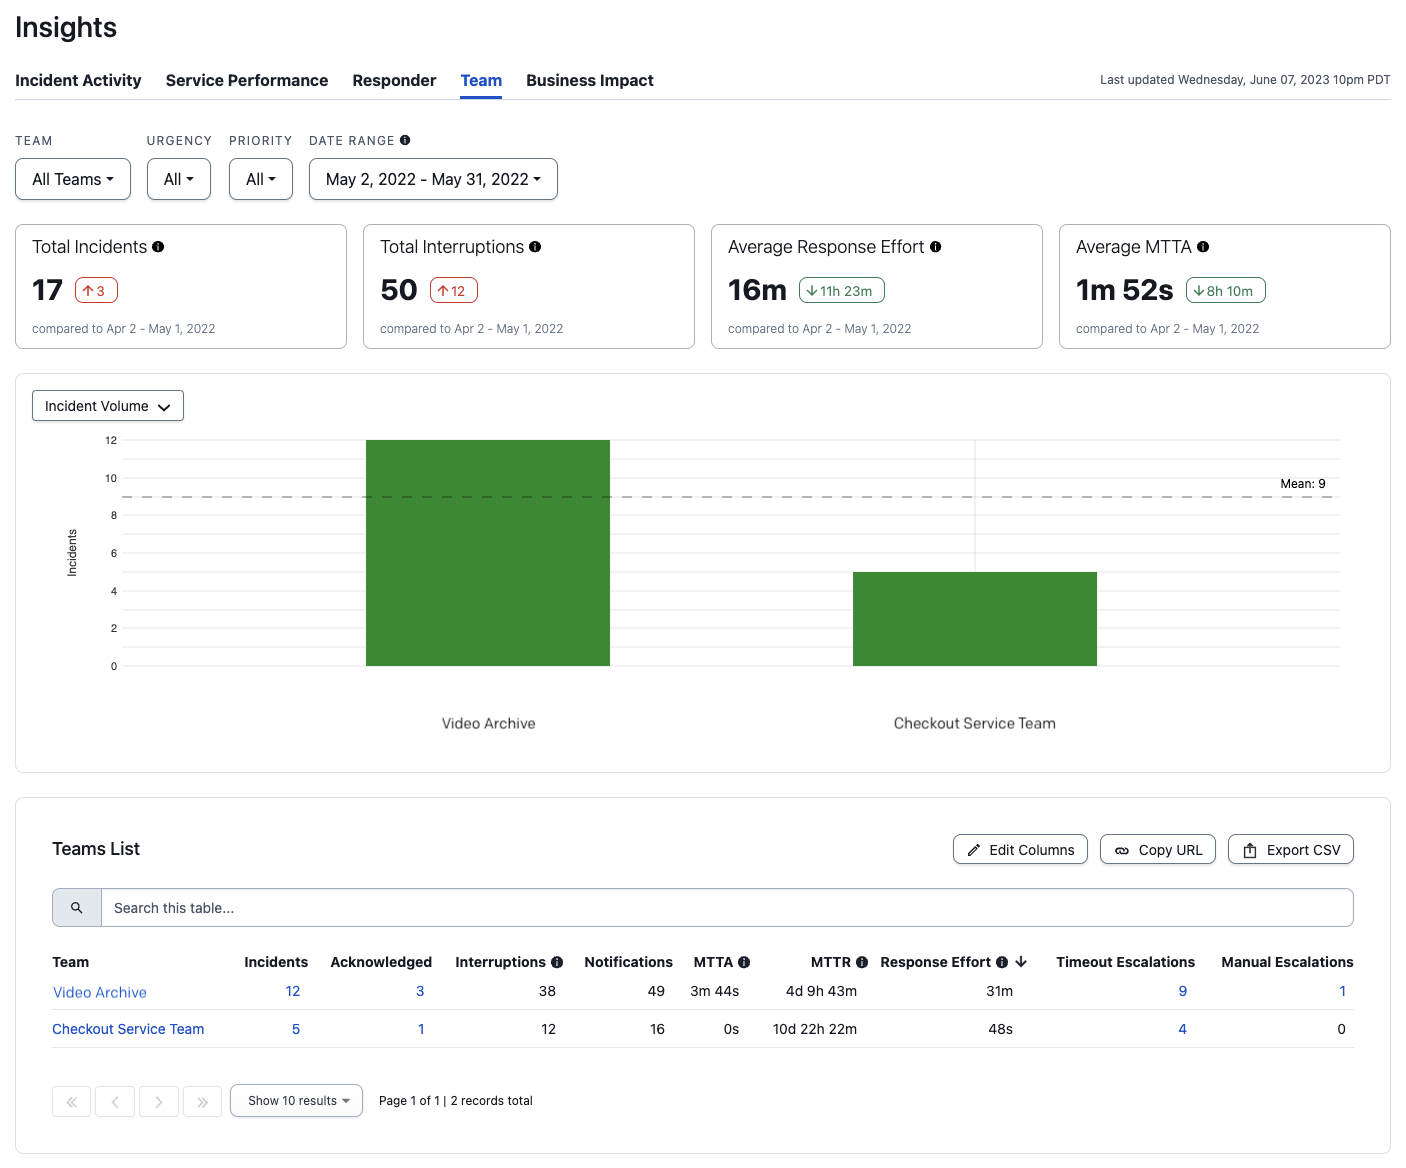
The Team report provides insights into the incident impact on Teams. It also includes a Teams List with metrics such as interruptions count, mean time to acknowledge (MTTA), mean time to resolve (MTTR) and response effort (incident duration).
To view the Team report, navigate to Analytics Insights Team tab.
Team Report
Filter and Search Team Health
You may optionally filter with the following parameters:
- Team: You can filter further by selecting the My Teams tab or All Teams tab or search for your preferred teams. Select each preferred Team’s checkbox and click Apply.
- Urgency: Select from All, High or Low urgency incidents.
- Priority: Select from All or any of your account’s preconfigured priority levels.
- Date Range: Select from Last 30 Days, Last 7 Days, Last Month, This Month or Custom Range. If you select Custom Range, select the range on the calendar and click Apply. Note: For custom ranges, you can select dates up to three years in the past.
Summary Metric Cards
- Total Incident Volume: The total count of incidents that all selected teams were engaged in across the specified date range.
- Total Interruption Volume: The total count of interruptions for all selected teams that occurred across the specified date range. Interruptions are when an on-call responder receives an SMS (text), mobile push or phone call notification. Notifications sent from various channels (SMS, push, phone) to the same destination are counted as one interruption.
- Average Response Effort: The average engaged time across selected teams during the specified date range. Response effort is measured from the time a responder acknowledges or accepts a responder request until the incident is resolved.
- Average MTTA: The average Mean Time to Acknowledge of all selected teams across the specified date range.
Data Visualizations
You can change the dropdown at the top left to select one of four visualizations:
- Incident Volume: Number of incidents per team
- Interruption Volume: Number of interruptions per team
- Response Effort: Number of hours per team
- MTTA: Mean time to acknowledge in seconds per team
Teams List
Below the data visualization you will see the Teams List data specific to the filters you have selected. You may perform the following actions with this table:
- Search: Use the search field to search for specific data.
- Sort: Click on a column header to sort results. You can also sort with multiple columns by holding down the shift key while clicking on both of the columns. The graph above will not change if you sort the data.
- Drill Down: Click a Team, incident count or acknowledged count in the Team, Incidents or Acknowledged columns to view more information about each.
To customize the columns you would like to view, click the Edit Columns button and select your preferred data. The available columns are:
- Team: The Team name.
- Team ID: The Team ID.
- Incidents: The total count of incidents that the Team experienced with the specified time period.
- Acknowledged: The total count of assigned incidents acknowledged by the Team. Only explicit incident acknowledgment counts; reassign, resolve, and escalation actions do not imply acknowledgement.
- Interruptions: The total count of incidents that interrupted during off and sleep hours (defined in Off and Sleep Hours Interruptions below) in responders’ local time.
- Notifications: The total count of incident notifications sent via email, SMS, phone call and push.
- MTTA (Mean time to Acknowledge): The average time for the first assigned user to acknowledge an incident. Reassign, resolve, and escalation actions do not imply acknowledgement.
- MTTR (Mean time to Resolve): The average time from when an incident was created until it was resolved.
- MTTE (Mean Time to Engage): The average time for assigned second, third, and nth responders to acknowledge an incident. It is similar to MTTA, but used only for subsequent escalations after the first assigned user does not respond.
- Response Effort: The total engaged time across all responders, measured from the time a responder acknowledges or accepts a responder request until the incident is resolved.
- Timeout Escalations: The total count of the user’s assigned incidents that were escalated due to timeouts.
- Manual Escalations: The total count of the user’s assigned incidents that were manually escalated away from a user without acknowledgement.
- Reassignments: The total count of a user’s assigned incidents that were manually reassigned to a user who is not on the original escalation policy, or to another escalation policy.
- MTTM (Mean Time to Mobilize): The time between start of an incident, and the last additional responder to acknowledge.
- Business Hour Interruptions: Total count of incidents that occurred between business hours. Business hours are defined as the time between 8am and 6pm everyday, based on the local time set on an account.
- Off Hour Interruptions: Total count of incidents that occurred between off hours. Off hours are defined as the time between 6pm and 10pm weekdays and all day weekends, based on the local time set on an account.
- Sleep Hour Interruptions: Total count of incidents that occurred between sleep hours. Sleep hours are defined as the time between 10pm and 8am everyday, based on the local time set on an account.
- Total Snoozed Seconds: Total seconds the incident has been snoozed.
By default, 10 results are shown at a time. Click the Show [x] results dropdown to select from 10, 20, 30, 40 or 50 results per page.
Share the Team Report
Please read Share a Report for more information on sharing or exporting the report.
Business Impact
The Business Impact report provides insights into how much services cost over time. It also includes a Services List with metrics such as response effort (incident duration), uptime percentage, mean time to resolve (MTTR) and mean time to acknowledge (MTTA).
To view the Business Impact report, navigate to Analytics Insights Business Impact tab.
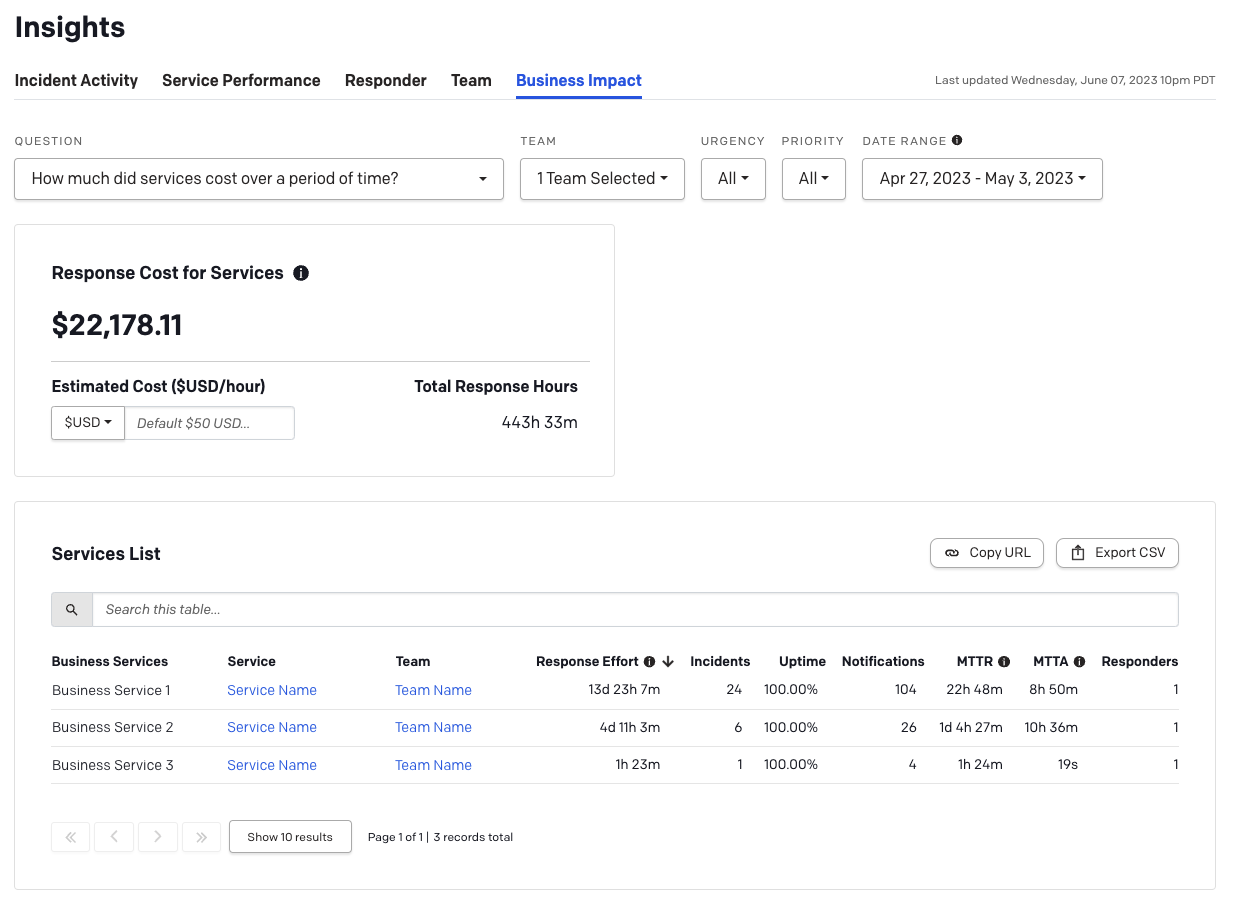
Business Impact Report
Filter and Search Business Impact
- In the Question dropdown, select a question that best represents your use case. Business Impact allows you to filter by the following question and corresponding Maturity Model data:
- How much did services cost over a period of time?: Response Effort, Incident Count, Uptime, Notification Count, MTTR, MTTA, Responder Count.
- You may optionally filter with the following parameters:
- Team: You can filter further by selecting the My Teams tab or All Teams tab or search for your preferred teams. Select each preferred Team’s checkbox and click Apply.
- Urgency: Select from All, High or Low urgency incidents.
- Priority: Select from All or any of your account’s preconfigured priority levels.
- Date Range: Select from Last 30 Days, Last 7 Days, Last Month, This Month or Custom Range. If you select Custom Range, select the range on the calendar and click Apply. Note: For custom ranges, you can select dates up to three years in the past.
Response Cost for Services
The Business Impact tab provides you with insights on the estimated response cost for your selected Teams and services. By default, the estimated cost per responder hour is set to $50. If you would like to change your estimated cost per responder hour, you can enter that in the Estimated Cost ($/hour) field and a new total value will be calculated based on that cost and the Total Response Hours.
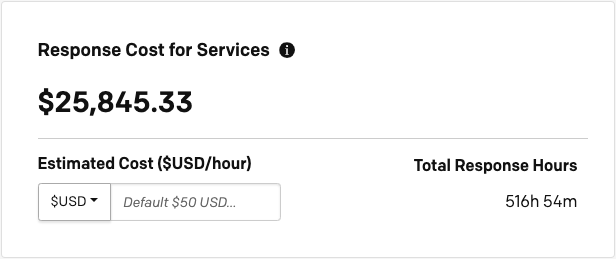
Response Cost for Services Estimate
Services List Table
Below the Response Cost for Services table you will see the Services List data specific to the filters you have selected. You may perform the following actions with this table:
- Search: Use the search field to search for specific data.
- Sort: Click on a column header to sort results. You can also sort with multiple columns by holding down the shift key while clicking on both of the columns.
- Drill Down: Click a service or a Team in the Service or Team columns to view more information about each.
The available Services List columns are:
- Business Services: The Business Service(s) mapped to each service.
- Service: The service name.
- Team: The Team each service belongs to. Teams allow users to group and control user access to associated PagerDuty objects, such as escalation policies, users, schedules and services.
- Response Effort: The total engaged time across all responders, measured from the time a responder acknowledges or accepts a responder request until the incident is resolved.
- Incidents: The total count of incidents that occurred on the service within the specified time period.
- Uptime: The percentage of uptime for each service.
- Notifications: The total count of incident notifications sent via email, SMS, phone call and push.
- MTTR (Mean time to Resolve): The average time from when an incident was created until it was resolved.
- MTTA (Mean time to Acknowledge): The average time between when an incident is first assigned to a user and when the incident is first acknowledged by that user. Reassign, resolve, and escalation actions do not imply acknowledgement.
- Responders: The total count of responders assigned per service.
By default, 10 results are shown at a time. Click the Show [x] results dropdown to select from 10, 20, 30, 40 or 50 results per page.
Share the Business Impact Report
Please read Share a Report below for more information on sharing or exporting the report.
Share a Report
To share a report, navigate to the bottom List table where you can copy the URL, share via Slack Insights, or export to CSV:
- Click Copy URL to save the URL to your clipboard and share the link with others. You can also use this URL create an unfurled link in Slack using our PagerDuty Analytics Slack Integration.
- Click Export CSV to generate a file,
export.csv, which will keep the view and results based on your search and filter selections.

Share a report
Recommendations
Availability
Recommendations are available to customers on Professional, Business, and Digital Operations pricing plans. Please contact our Sales Team if you would like to upgrade to a plan featuring Recommendations.
Recommendations provide a view into where your services stand in relation to the Maturity Model, along with single, push-button configuration of helpful settings to drive further maturity. Recommendations can be found by navigating to Analytics Recommendations.
Filter, Search and View Recommendations
- You will see a list of all Service Recommendations in your account. You may optionally filter by Teams: You can filter further by selecting the My Teams tab or All Teams tab or search for your preferred teams. Select each preferred Team’s checkbox and click Apply. You may also search this list to drill down to specific data. Note: The Service Recommendations list will display a maximum amount of 20 recommendations.
- Once you have filtered and searched for the data you are looking for, click the name of the Service to view further details about its recommendations.
- On the next screen, you will see this service’s Maturity Rating, which is based on a comparison of all services across your account. Maturity ratings range from A (lowest noise) to E (highest noise). You will also see the Recommendation for this service, with an explanation of the benefit to the service, as well as a button to automatically Enable the recommended configuration. Finally, you will see a Preview of how this recommended configuration would affect your account if enabled.
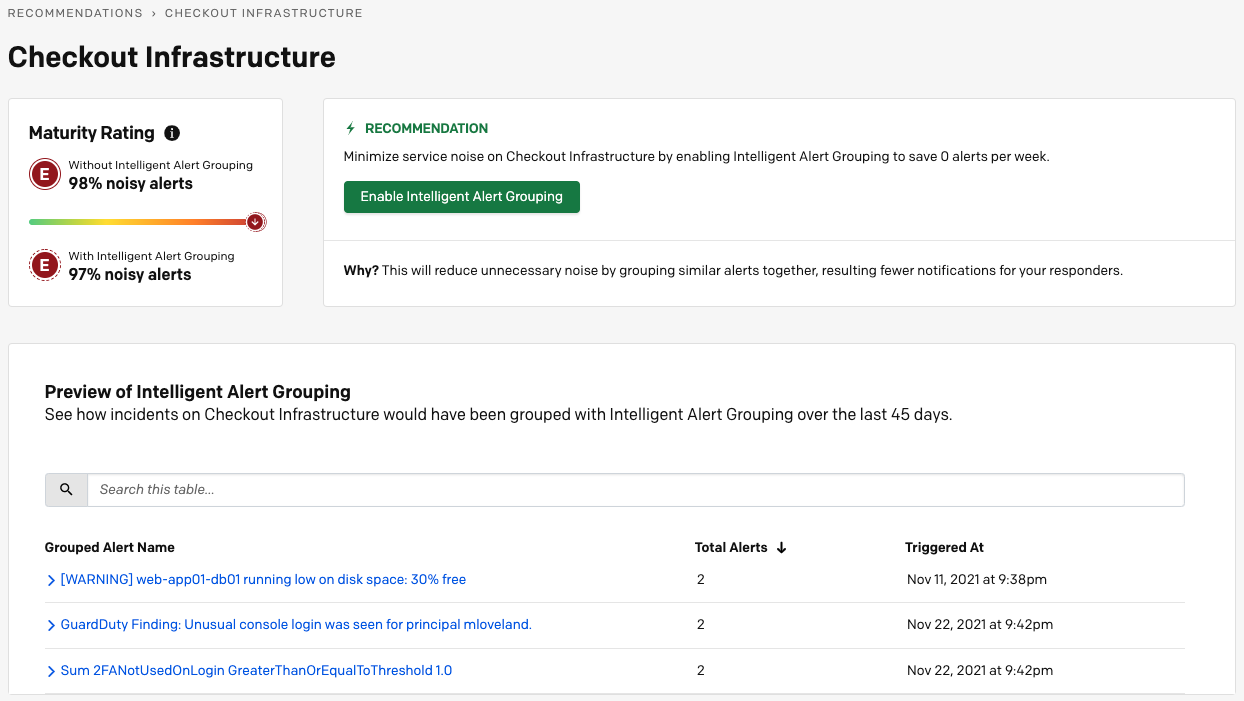
Service Recommendations
Updated about 1 year ago
