Mobile Home Screen
The mobile Home screen highlights top open incidents, and displays on-call shift and service information, which broadens awareness and streamlines navigation to other important, non-incident information.
You can navigate to the Home screen in the mobile app by tapping Home in the app's navigation bar:
- Status Dashboard Widget
- My Open Incidents
- On-Call Shifts
- Analytics on Mobile
- Recently Impacted Technical Service
Status Dashboard Widget
The Home screen displays a condensed view of the Mobile Status Dashboard, and gives you an overview of your account's incident-impacted business services. Please read Home Screen Status Dashboard for more information.
My Open Incidents
The My Open Incidents section displays incidents that are assigned to you, indicates the total number in the top-left, and provides an overview of your three most-recent, open incidents. Tap an incident’s row to navigate to its details page, where you can find more information about the incident, and acknowledge or resolve it.
Tap New Incident to trigger an incident.
If you have more than three incidents, tap Show More to expand the list. The expanded list will display up to 10 incidents, and you can tap View All Open Incidents to view all open incidents on the Open Incidents screen.
Note: The Open Incidents screen will remember which tab filter you most recently selected (Mine, My Teams or All), which reduces the number of taps needed to display relevant incidents.
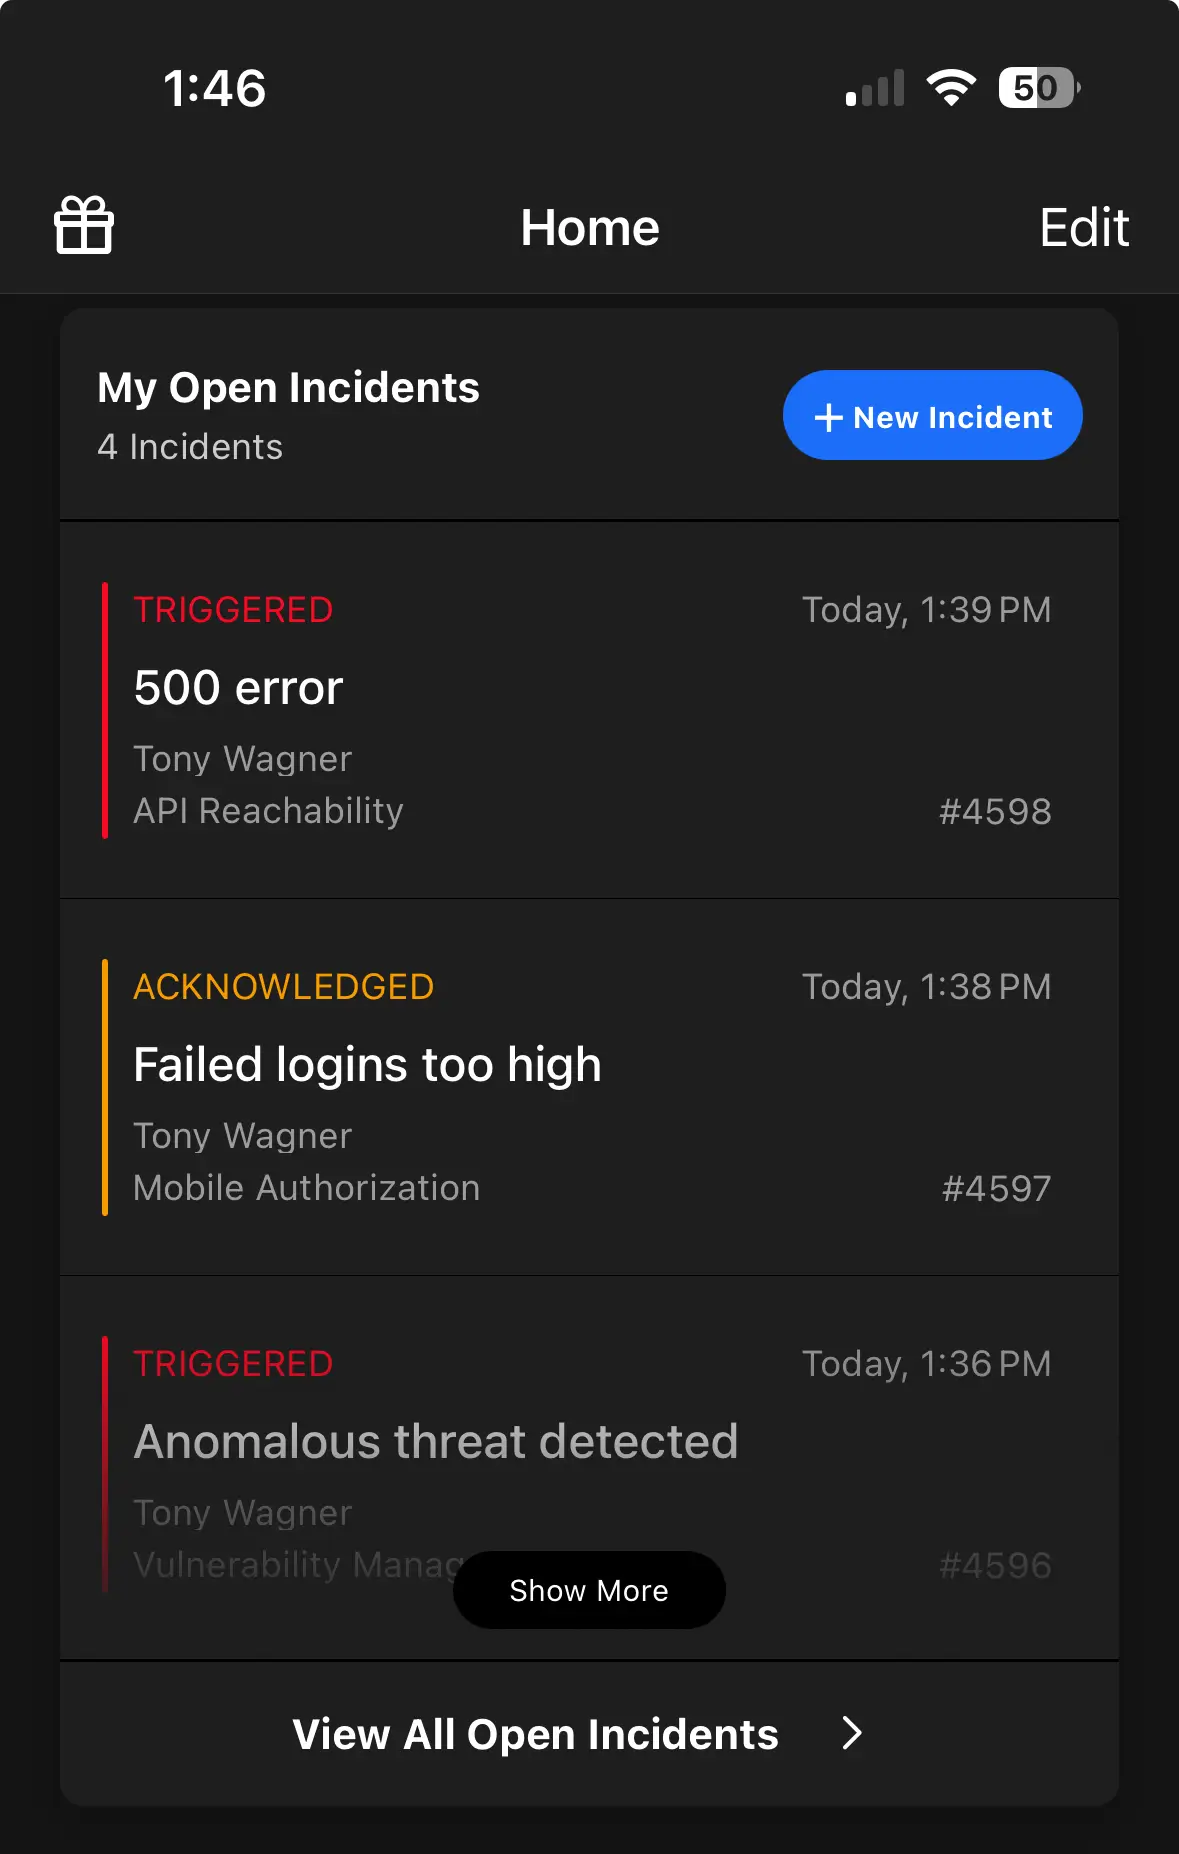
My Open Incidents
On-Call Shifts
This section details up to three of your current on-call shifts. Tap to the right of a shift to view more options, for example: Go To Schedule, Go To Escalation Policy, Create an Override…, Go To My On-Call Shifts.
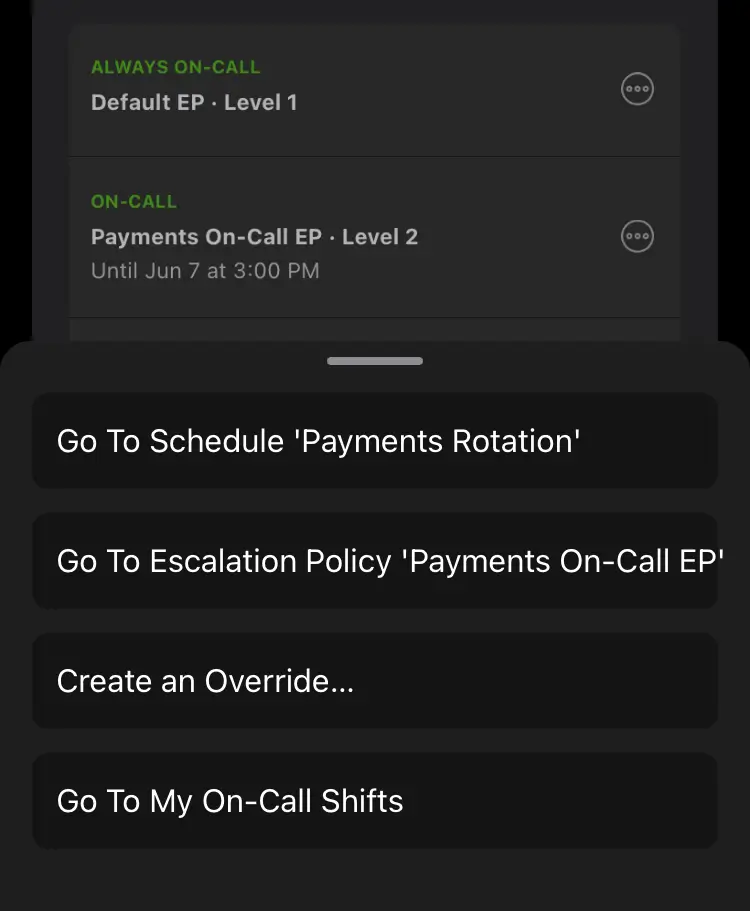
On-call shifts
Tap View All Shifts to go to the My On-Call Shifts screen for a detailed overview of all your on-call responsibilities.
Analytics On Mobile
AvailabilityAnalytics on Mobile is available on the following pricing plans: Professional, Business, Digital Operations (legacy) and Enterprise for Incident Management.
Please contact our Sales team to upgrade to a plan with this feature.
You can see an analytics overview on the Home Screen for the Teams you are a part of. If your account does not have Teams, you'll see analytics for your entire organization.
The Analytics section displays information from the previous month for the following metrics:
- High Urgency Incidents
- MTTA (Mean time to acknowledge)
- MTTR (Mean time to resolve)
Change trends are compared to metrics from the 30 days prior to the displayed date range.
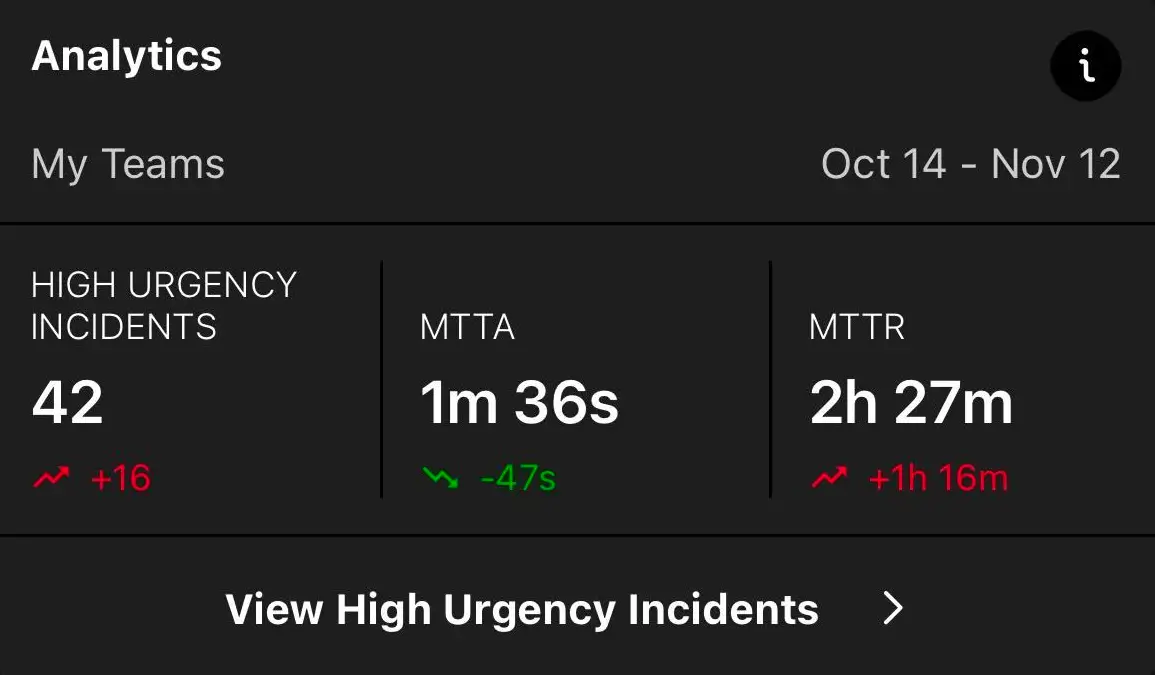
Analytics on the Mobile Home Screen
Recently Impacted Technical Service
This section displays the most recently impacted technical service associated with your Teams. If your account does not have the Teams feature, it will display the most recently impacted technical service in your PagerDuty account.
For an overview of all services in your PagerDuty account, tap View Services to go to the Service Directory.
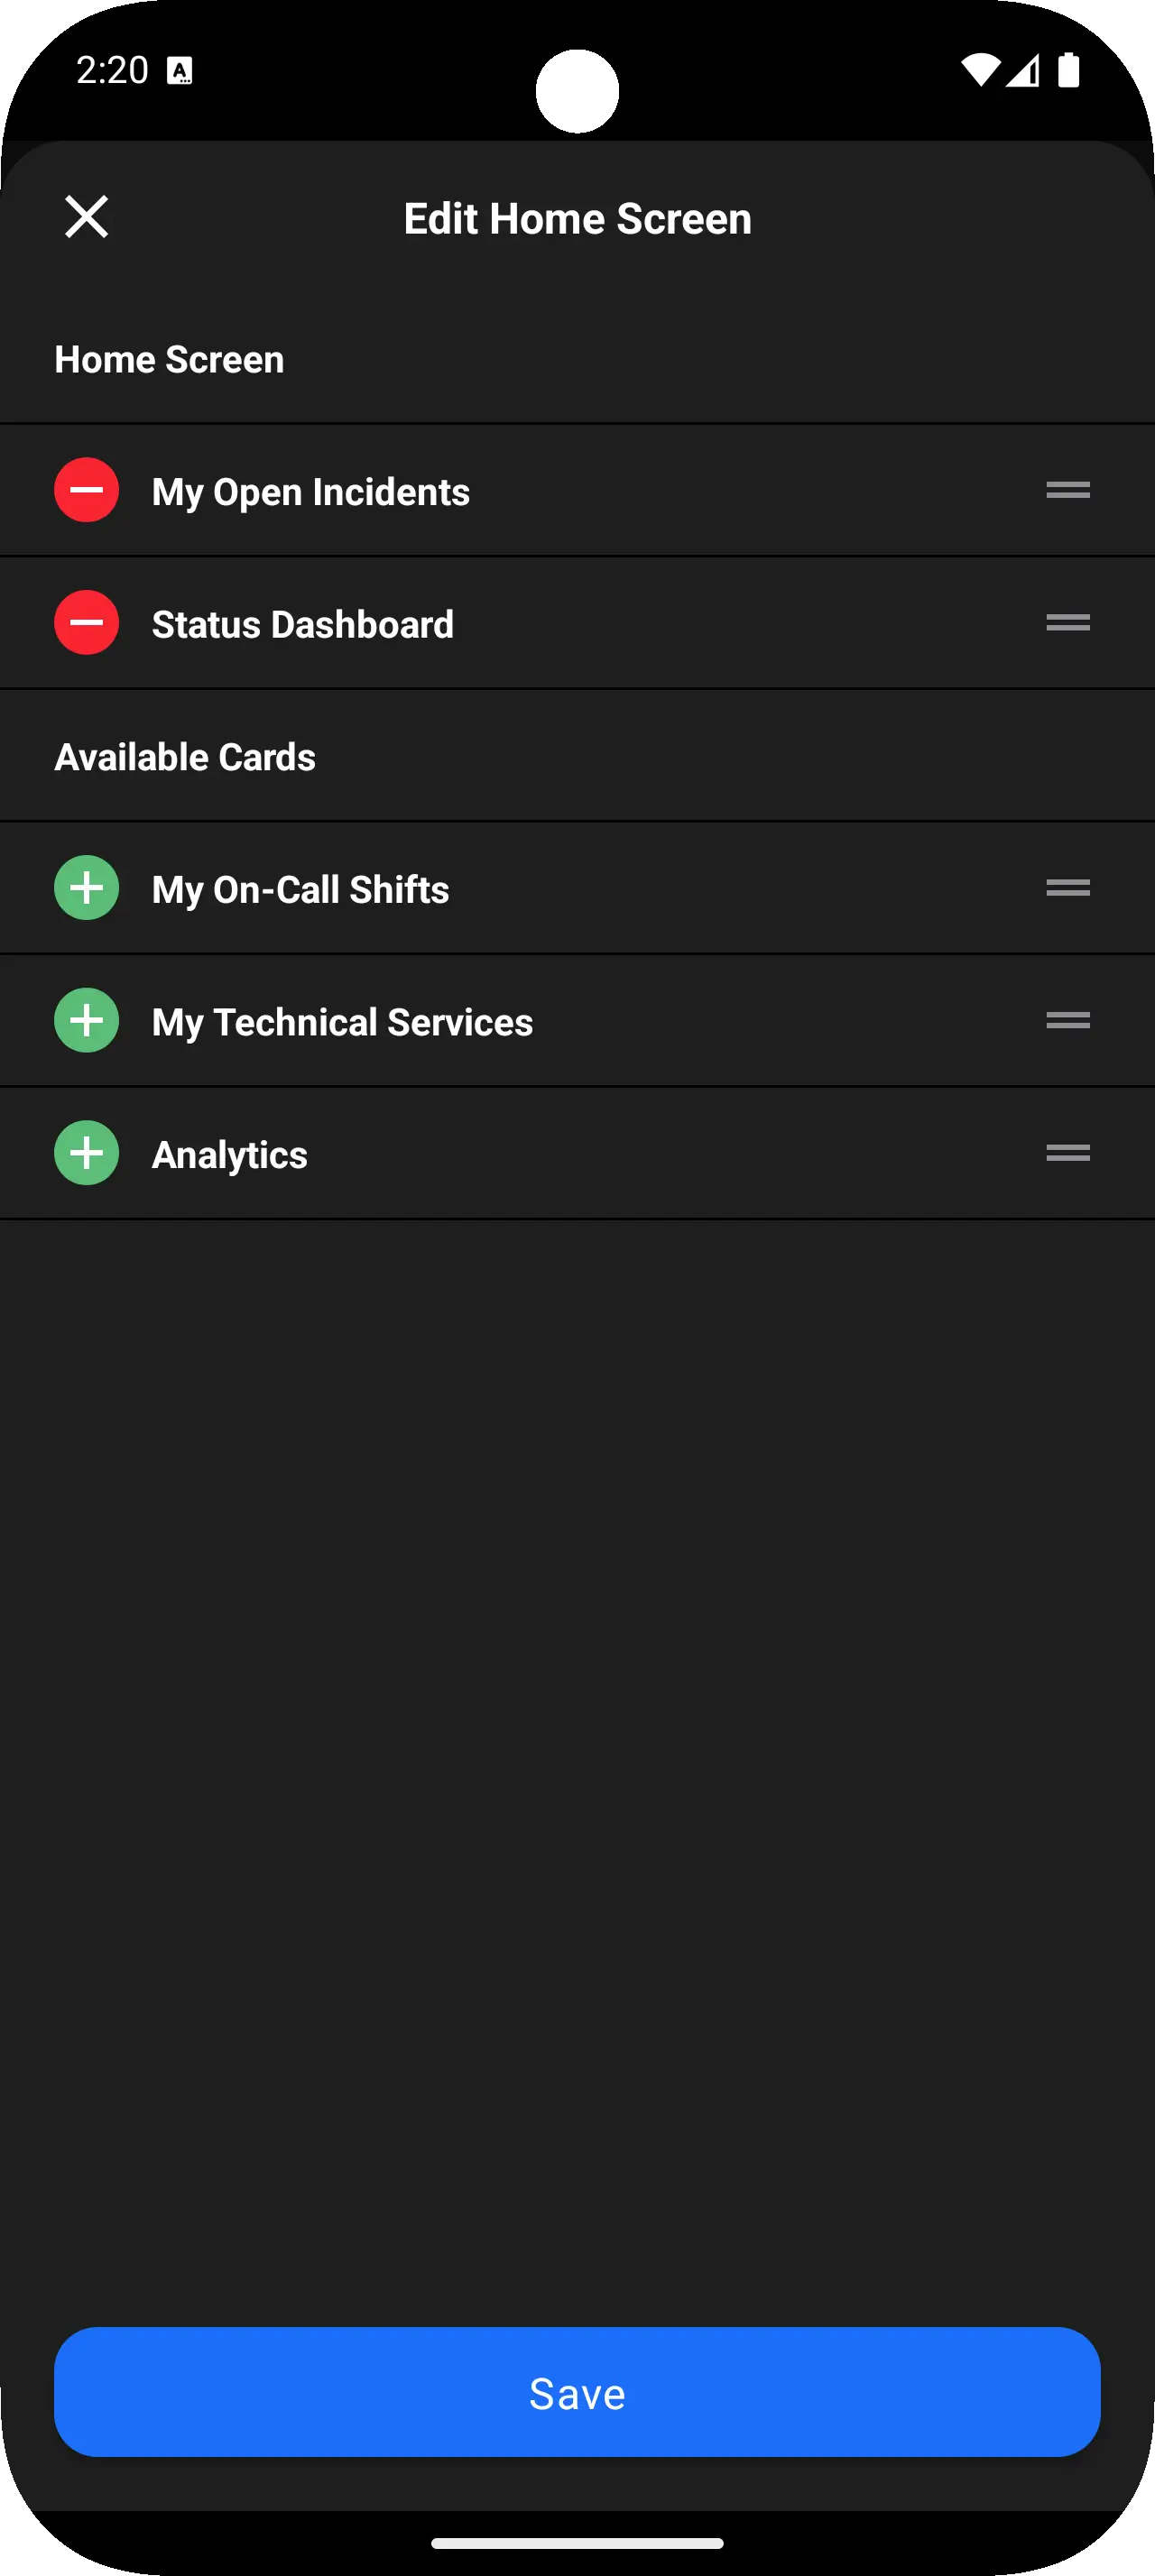
Customize Your Home Screen
Multiple AccountsIf you have more than one PagerDuty account, you can save different customizations for each account.
Device InformationInstructions and screenshots below are for the following devices. Depending on your device and operating system, information may vary slightly:
- iOS: iPhone 16 Pro, iOS 18.1
- Android: Pixel 9 Pro, Android 15.0
iOS
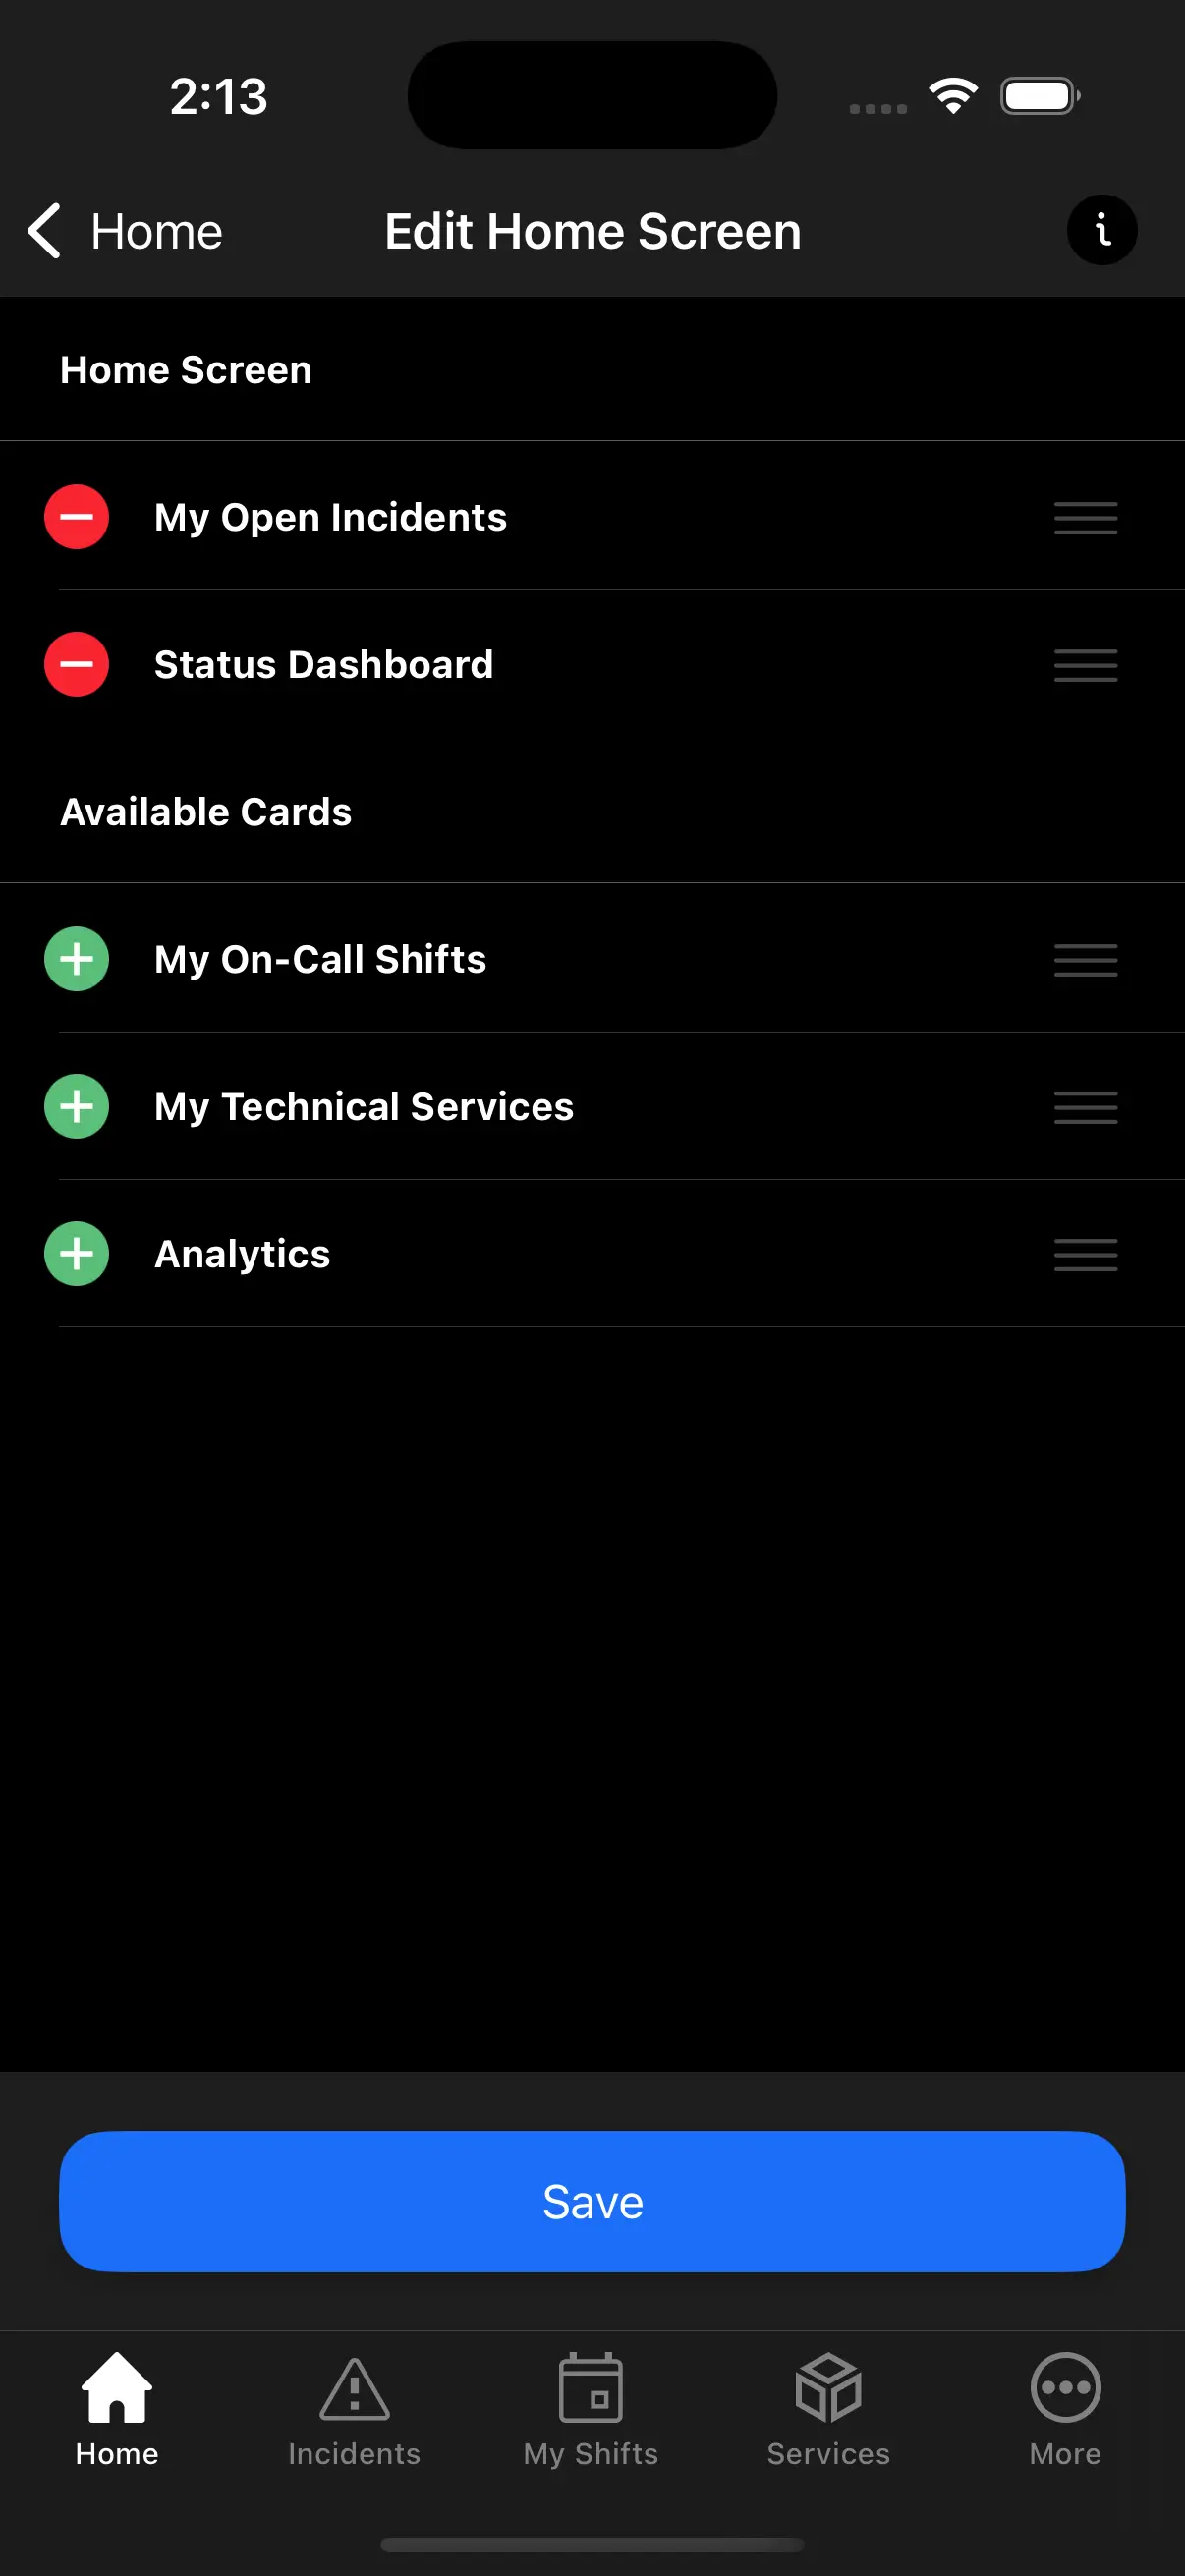
- Tap Home Edit.
- Tap next to a card to add it to your Home Screen. Tap to remove a card from your Home Screen.
- Note: You must have at least one card on your Home Screen.
- Optional: Tap and drag to reorder the cards.
- Tap Save.
Android
- Tap Home .
- Tap next to a card to add it to your Home Screen. Tap to remove a card from your Home Screen.
- Note: You must have at least one card on your Home Screen.
- Optional: Tap and drag to reorder the cards.
- Tap Save.
Updated about 1 month ago
