
Visibility Console
The Visibility Console provides a centralized location to monitor digital operations in real time. This feature provides NOC teams and technical stakeholders with context on their technical environment at a glance, allowing them to quickly understand the health of their digital operations.
AvailabilityThis feature is available with the PagerDuty AIOps add-on. To sign up for a trial of PagerDuty AIOps features, read PagerDuty AIOps Trials.
End-of-LifeBeginning October 31, 2025 for month-to-month accounts and January 31, 2026 for term accounts with active usage, Visibility Console will reach end-of-life and be removed from the PagerDuty web app.
See the FAQ below for more information.
In the PagerDuty web app, navigate to Incidents Visibility Console.
Each user has access to their own real-time Visibility Console, which is unique to their account. The console offers several modules with global filtering, which allows you to filter modules by a combination of Teams, services, and incident priorities.
Configure the Visibility Console
Modules can be added, moved, edited, or removed from the Visibility Console.
Personalized ViewEach user has access to a personalized Visibility Console. Changes and adjustments in one user's account will not affect other users' views.
Add a Module
- Navigate to Incidents Visibility Console.
- Click Add Module and select a module.
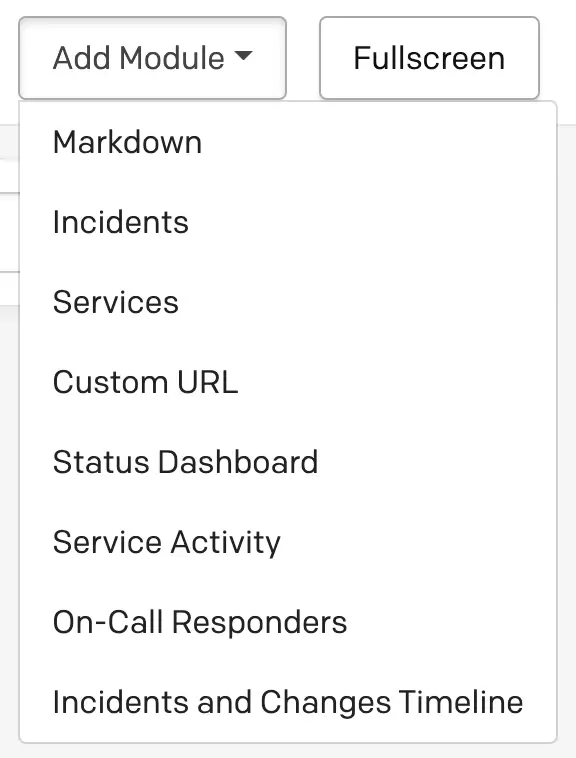
Add module
Move a Module
- Navigate to Incidents Visibility Console.
- Click a module's icon and drag it to a different location in the Visibility Console.
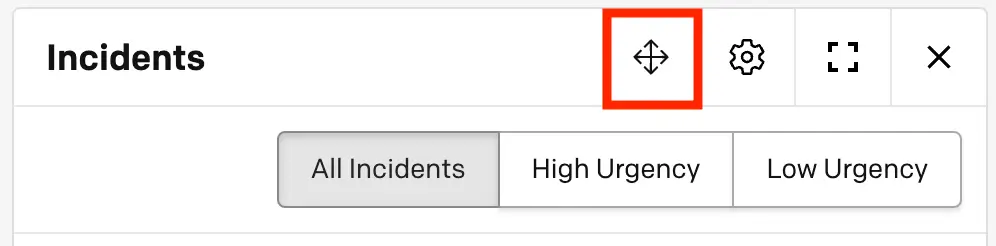
Move a module
Resize a Module
You can resize a module by clicking and dragging the bottom-right corner.
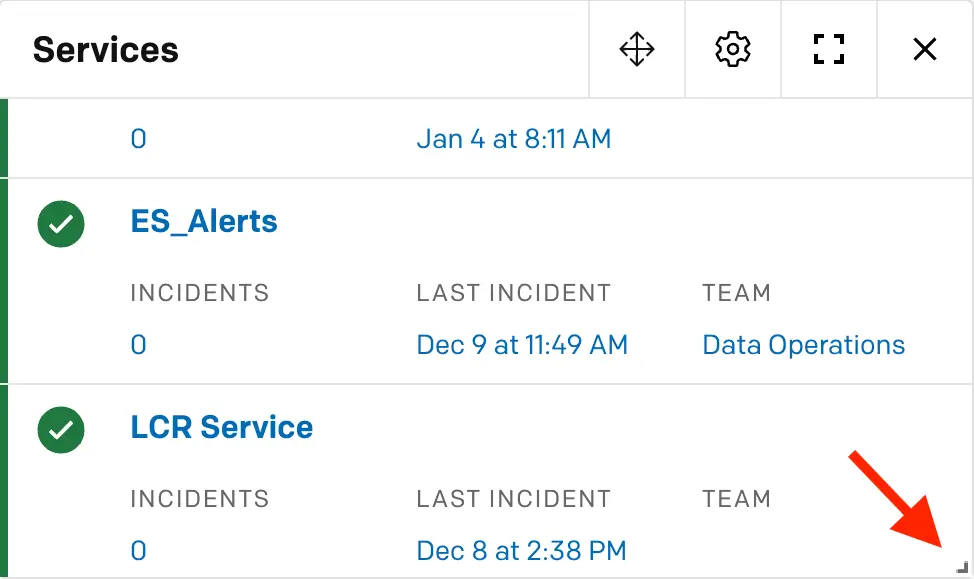
Resize a module
Edit a Module
- Navigate to Incidents Visibility Console.
- Click a module's icon and make your desired edits.
- Click Save.
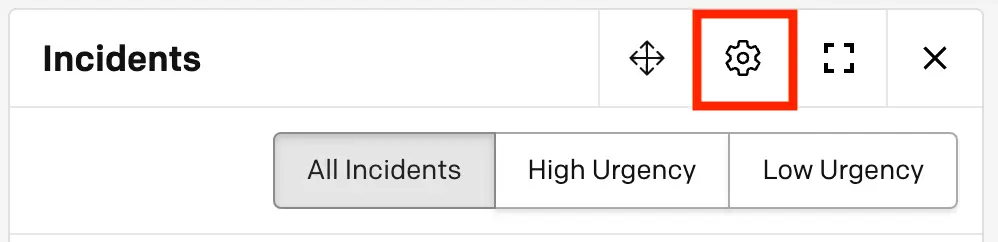
Edit a module
Remove a Module
- Navigate to Incidents Visibility Console.
- Click a module's icon.
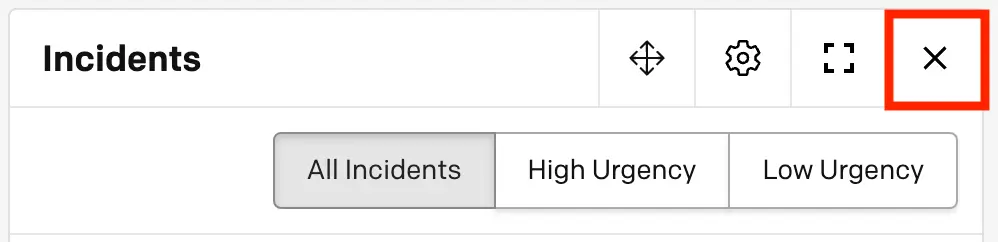
Remove a module
- Confirm your selection in the dialog window that appears.
Global Filtering
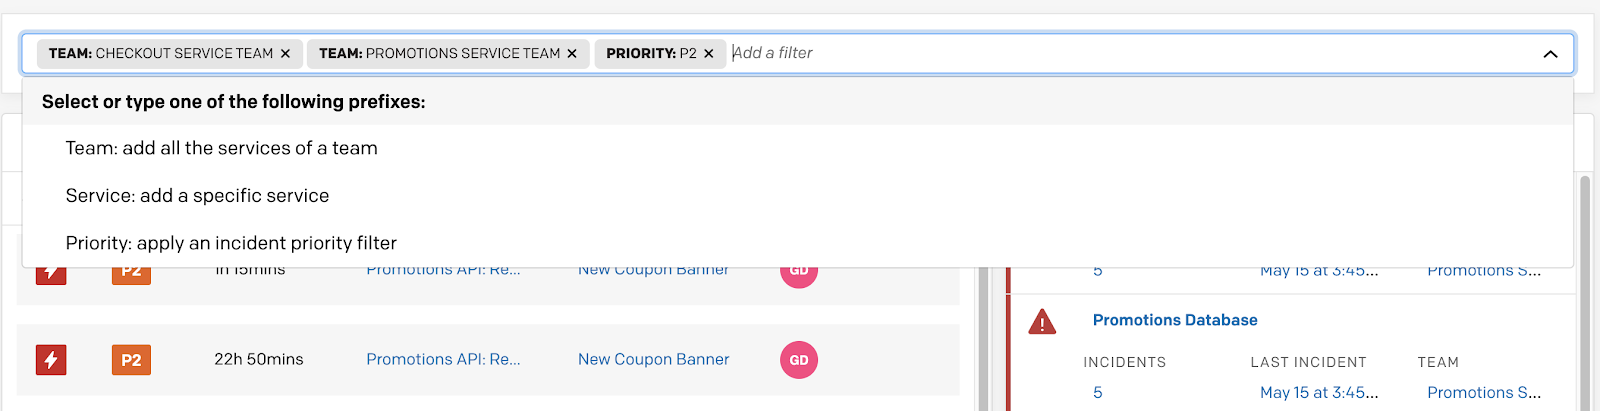
To show a specific group of services or incidents, you can add filter tags to the global filter bar. Click the filter bar dropdown and select your preferred tags:
- Team: The Team tag will add all the services owned by a Team to the group of services shown.
- Service: The service tag will add the specific service to the group of services shown.
- Priority: The priority tag will filter the Incidents module to only show incidents that have an Incident Priority.
Filtering ScopeFiltering only impacts the Incidents, Services, Service Activity, and On-Call Responders modules. The priority tag only filters the Incidents module.
Global filtering
Visibility Console Modules
The Visibility Console is made up of many smaller modules. Data flows into the Visibility Console in real time and each module auto-refreshes every 30 seconds.
The Incidents, Services, and Service Activity modules load the 100 most-recent results. You can use global filters to narrow results to more relevant items.
Markdown
The Markdown module allows you to add any text or notes to your console. This can be used to display instructions, add hyperlinks to frequently used documentation, link to runbooks, or take general notes during an on-call shift or investigation.
Incidents
The Incidents module displays a real-time list, based on the filters selected, of the most recent open incidents that have triggered. It sorts the incidents by most recent trigger time and shows the status, priority, title of the incident, the service impacted, and the assigned responders. The module can be filtered by All Incidents, High Urgency, and Low Urgency.
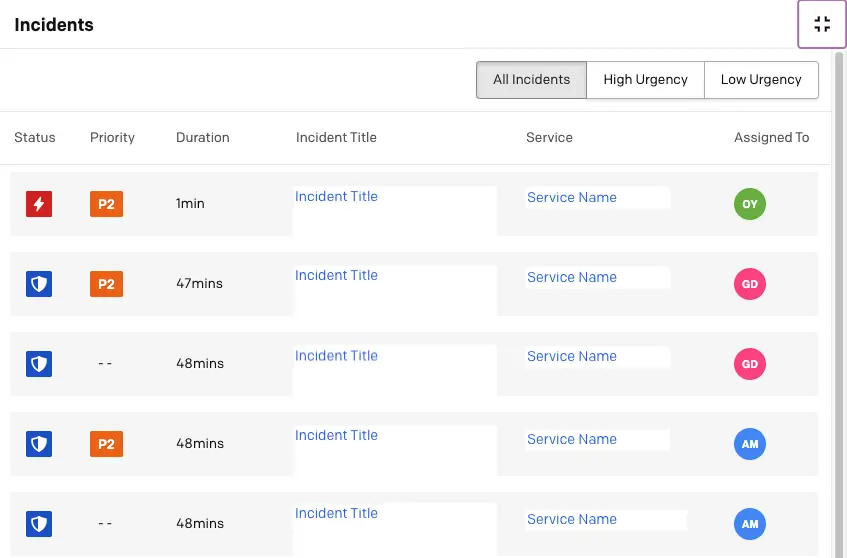
Incidents module
Incident Actions in the Incidents Module
To take action on incidents in the Incidents module, select the checkbox to the left of the incident(s) and click your desired action: Acknowledge, Resolve, Snooze, Change Priority, or Add Note.
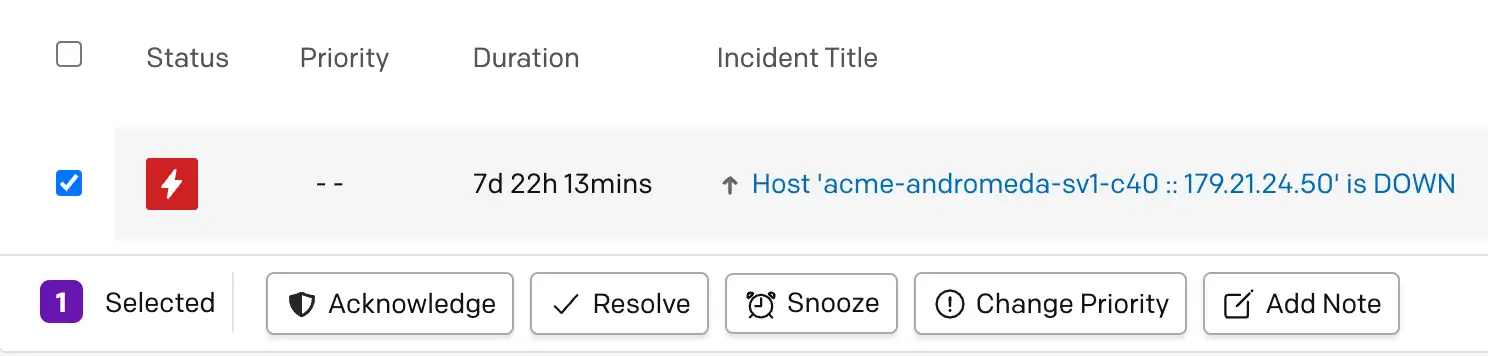
Incident actions in the Incidents module
Services
The Services module is ordered similarly to the Service Activity module and offers additional context on a service's current state. Each service will display the associated Team (if configured), the number of open incidents, the time of the last incident, and the current state of the service.
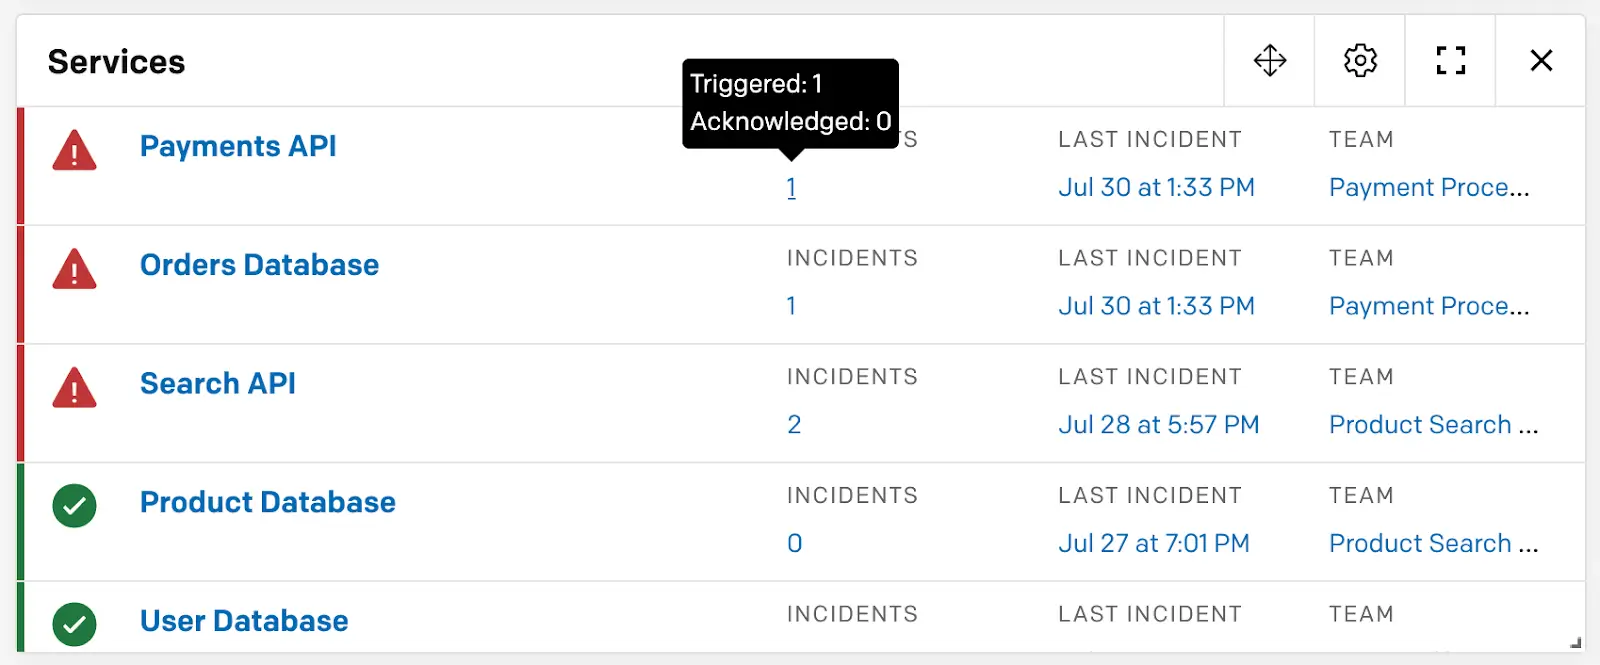
Services module
Definitions of different technical service states:
- Awaiting Response: The service currently has one or more incidents in a triggered state waiting on a response.
- Response in Progress: The service currently has one or more incidents in an acknowledged state waiting on resolution.
- Maintenance Window: The service is currently in a Maintenance Window or is disabled, meaning any incoming events on the service will not trigger an incident.
- Without Open Incidents: The service currently has zero open incidents.
Custom URL
The Custom URL module allows you to embed external web pages in an iframe to add external monitoring to the Visibility Console. Any PagerDuty webpage is embeddable, as well as many external status pages and public dashboard URLs.
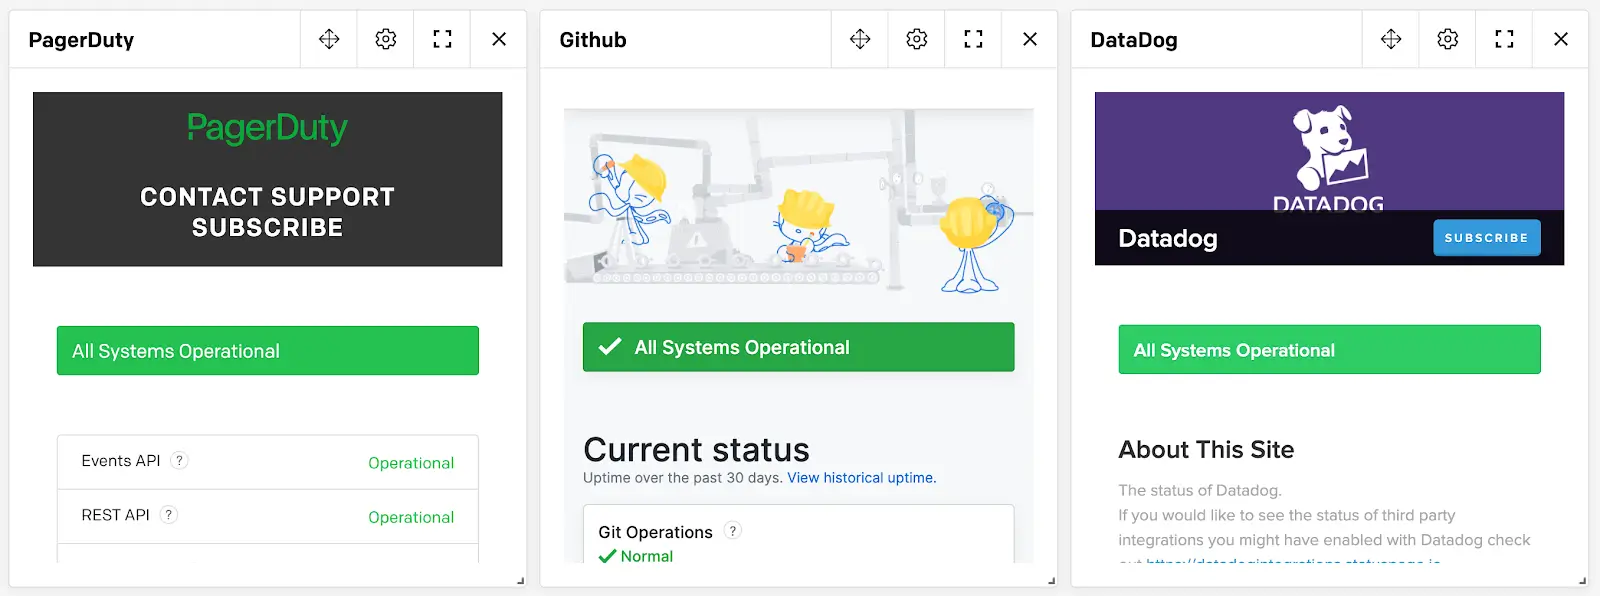
Custom URL module
Security Limitations
Not all web pages can be embedded. The Custom URL module has some limitations in place to ensure security.
Custom URL Requirements
Ensure the following for any URL you would like to embed:
- You must use the
Content-Security-Policy: frame-ancestorsin the response header for the URL. - Xframe is obsolete in most modern browsers, but if you are running into this issue, you may need to set the
ALLOW-FROMfield.
Troubleshooting URLs That Will Not Load
Some URLs may not load for the following reasons:
- The page has restricted CSP.
- The page explicitly blocks Xframes.
- The page cannot be served over HTTPS (PagerDuty only serves over HTTPS).
Status Dashboard
The Status Dashboard module brings in information from the Internal Status Page and adds that context to the console so you can monitor the status of your business services in one place. Click to expand a business service and show its description.
If a supporting technical service is experiencing an incident, you can select the business service's name to view a list of impacting incidents. This ensures stakeholders and response teams are always up to date with the live status of system health.
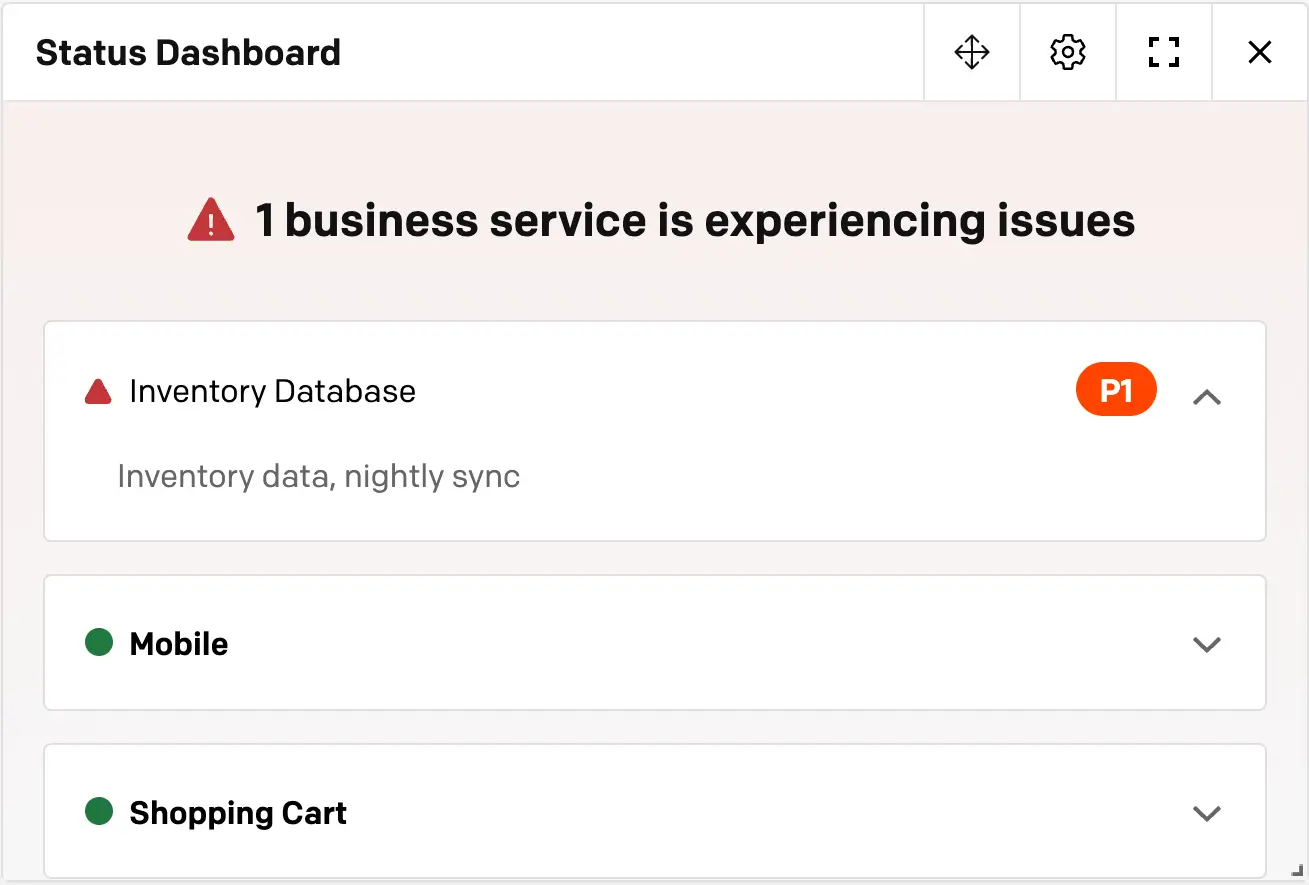
Status Dashboard module
AvailabilityThe Status Dashboard module is only available to accounts that have Visibility and Internal Status Page features.
Service Activity
The Service Activity module allows you to see incident activity across many of your services at once, so you can quickly understand your digital operations health and identify if there is a widespread major incident. This module is ordered by most recently impacted service and will reorder itself when new incidents trigger. It has different time windows so monitoring teams can observe digital operations in real time, but can also see service activity in the last 7 days, 24 hours, 12 hours, 6 hours, or 1 hour. Click each cell for more details about the incidents affecting service activity. This module can be filtered to any set of Teams and services.
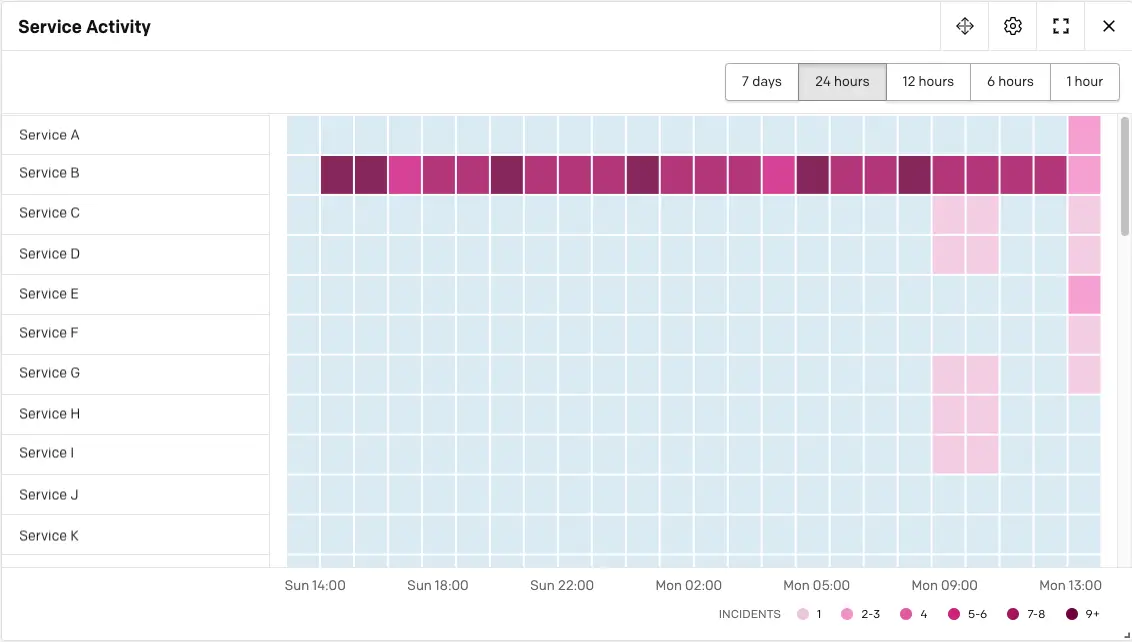
Service Activity module
On-Call Responders
The On-Call Responders module provides a quick way to search which users are on call across all escalation policies. Use the search field or select your desired escalation policy from the list and click to view more details about the users that are currently on call.
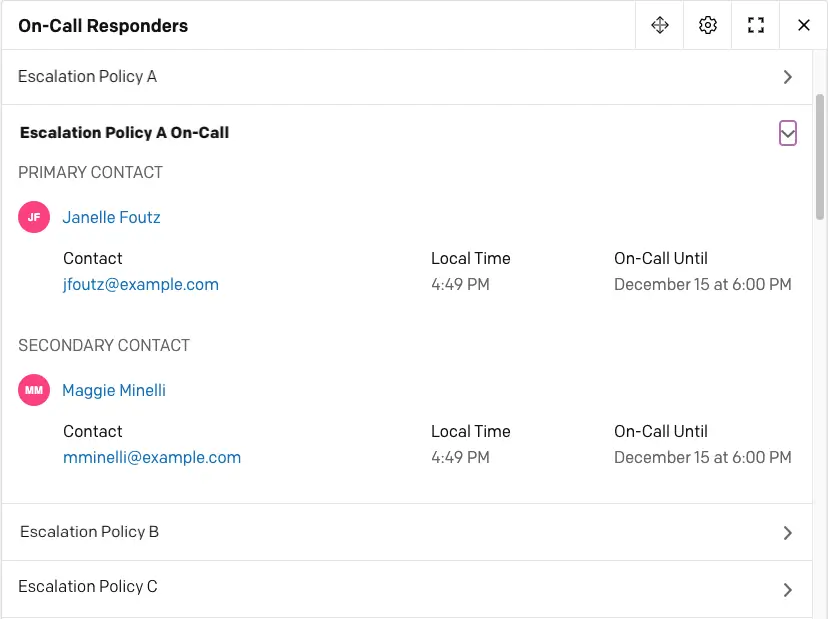
On-Call Responders module
Incidents and Changes Timeline
The Incidents and Changes Timeline module displays a timeline of incidents and change events across all services. The module can be filtered by the last 7 days, 24 hours, 12 hours, 6 hours, or 1 hour.

Incidents and Changes Timeline module
FAQ
What is happening to the Visibility Console?
PagerDuty is sunsetting the Visibility Console to better align our platform with evolving customer needs and deliver a unified operational experience. The core capabilities are being replaced by the Operations Console.
When will the Visibility Console be discontinued?
- Month-to-month accounts: October 31, 2025
- Term accounts with inactive usage: January 31, 2026
- Term accounts with active usage: TBD
What happens after the end date?
After the sunset date, you will lose access to Visibility Console. To maintain similar functionality, you will need to access Operations Console, which is part of the AIOps SKU.
How do I get access to Operations Console?
- Minimal/no usage accounts: You must opt in by submitting your request to this form to get Operations Console access.
- Active users: We will provide more information, including the actual EOL date, before the end of fiscal year 2025. If you are not currently on the AIOps SKU, you will be receiving trial access to Operations Console until the end of your current contract term. After that, you will need to purchase AIOps to ensure a seamless experience.
What replaces the Visibility Console?
The Operations Console replaces most Visibility Console functionality. Here is what is available:
| Visibility Console Module | Replacement |
|---|---|
| Incident | Operations Console |
| Service Activity | Operations Console — filter by a list of technical services and see the incident list and details. |
| Service | Operations Console — filter by a list of technical services and see the incident list and details. Service Directory — equivalent incident and Team information by technical service. |
| Status Dashboard | Status Page |
| On-Call Responder | Schedule |
| Recent Changes | AIOps Recent Changes |
| Incident Change Timeline | AIOps Recent Changes |
| Custom URL | Operations Console (via external references) |
| Text/Markdown | Users can export content manually. The account team can assist with this process upon request. |
Will I lose my historical data?
Most data will transfer to the replacement modules automatically, but you should start using Operations Console now to match your current Visibility Console setup. Exception: Data in the Markdown Module must be manually copied if you want to preserve it.
Do I need to update integrations or APIs?
For most use cases, no changes are required. If you have custom workflows built around Visibility Console, contact your account team for a technical review.
What happens after my current contract term ends?
To maintain access to Operations Console after your contract term, you will need to purchase or renew the AIOps SKU.
Will there be additional charges?
There are no additional charges for replacement functionality during your existing contract. If you choose to upgrade to AIOps, AIOps pricing applies.
What support is available during the transition?
- Operations Console Guided Product Tour
- Live demos with Solution Consultants
- Direct support from your account team
What should I do to prepare?
1. Start using Operations Console now to configure it to match your current Visibility Console setup.
2. Export any Markdown Module data you want to preserve.
3. Contact your account team with questions or for migration assistance.
4. Consider upgrading to AIOps to ensure continued access beyond your current contract term.
Where can I learn more about Operations Console?
- Product Tour
- Contact your account team for personalized assistance.
How does this affect compliance requirements?
Operations Console is FedRAMP-Low-authorized, providing better compliance alignment than the legacy Visibility Console.
How can I request more help?
Contact your PagerDuty account team for personalized migration support and to discuss your specific requirements.
Updated about 2 months ago