
Datadog Apps Integration Guide | PagerDuty
Configure the Datadog Apps integration
Datadog Apps and PagerDuty Benefits
You can view information from PagerDuty in your Datadog dashboard.
You can take action on PagerDuty incidents in your Datadog dashboard.
You can navigate quickly from Datadog to PagerDuty to view details.
Requirements
To use Datadog apps, you must first install the PagerDuty UI integration in your Datadog account.
- In Datadog, navigate to Integrations.
- Search for the PagerDuty UI integration and click Install.
After the PagerDuty UI integration is installed, follow the individual configuration steps for each app. The following apps are available:
Status Dashboards by PagerDuty
- View the status of PagerDuty business services from your Datadog dashboard.
- Navigate quickly from Datadog to PagerDuty business services and their incident details.
Requirements
In PagerDuty:
- The PagerDuty status dashboard feature is only available on the following pricing plans: Business, Digital Operations (legacy) and Enterprise for incident management. Contact the PagerDuty Sales Team to upgrade to a plan including the status dashboard feature.
In Datadog:
- This integration requires the
dashboards_writepermission in Datadog.
How It Works
- When a PagerDuty business service is impacted by an incident on one of its supporting services, the Status Dashboards by PagerDuty app updates with its status.
Integration Walkthrough
Configure PagerDuty
- To use the Status Dashboards by PagerDuty app, configure an Internal Status Page in your PagerDuty account.
Configure Datadog
- In your Datadog account, navigate to Dashboards. Select the dashboard where you want to add the Status Dashboard app, or create a new dashboard.
- In the dashboard, click Add Widgets to the right of the dashboard title. With the widgets pane expanded, select the UI Extensions tab and click Incidents by PagerDuty.
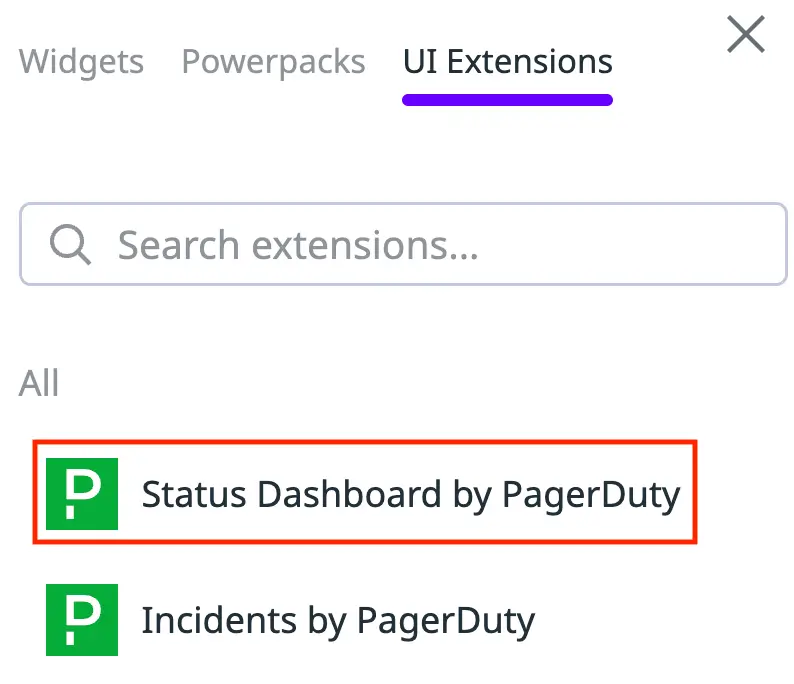
Status Dashboard by PagerDuty
- In the Status Dashboard by PagerDuty Editor modal, click Connect.
- Click Sign in to PagerDuty and complete the login process.
- You are redirected to the Editor modal where you see a preview of how the app appears. Configure the following fields:
| Field | Value |
|---|---|
| Options | Select from the dropdown to choose which Internal Status Page is displayed by default. |
| Widget title | (Optional) Enter a title for the widget. |
- Click Save to add the app to your dashboard.
Using Status Dashboards by PagerDuty
View Status Dashboards by PagerDuty
Navigate to Dashboards and select the dashboard with the app configured.
View Related Business Services
Click to the right of a business service to view related business services.
View Details in PagerDuty
Click the Business Service name to view it within PagerDuty. To view the PagerDuty status dashboard, click Go to PagerDuty.
Log Out of the Status Dashboard
To log out of the status dashboard of this account, click and select Log out.
Incidents by PagerDuty
- View and take action on up to 20 active incidents from your teams within the Datadog dashboard.
- Navigate quickly from Datadog to PagerDuty to view full incident and service details.
Requirements
In Datadog:
- This integration requires the
dashboards_writepermission in Datadog.
How It Works
- When there are active, high-urgency PagerDuty incidents associated with your team, the Incidents by PagerDuty app updates its incident list.
- Incidents by PagerDuty displays up to 20 active incidents. You can navigate to PagerDuty to view individual incidents and their services, or view all incidents.
Integration Walkthrough
Configure Datadog
- In your Datadog account, navigate to Dashboards. Select the dashboard where you want to add the Incidents by PagerDuty app, or create a new dashboard.
- In the dashboard, click Add Widgets to the right of the dashboard title. With the widgets pane expanded, select the UI Extensions tab and click Incidents by PagerDuty.
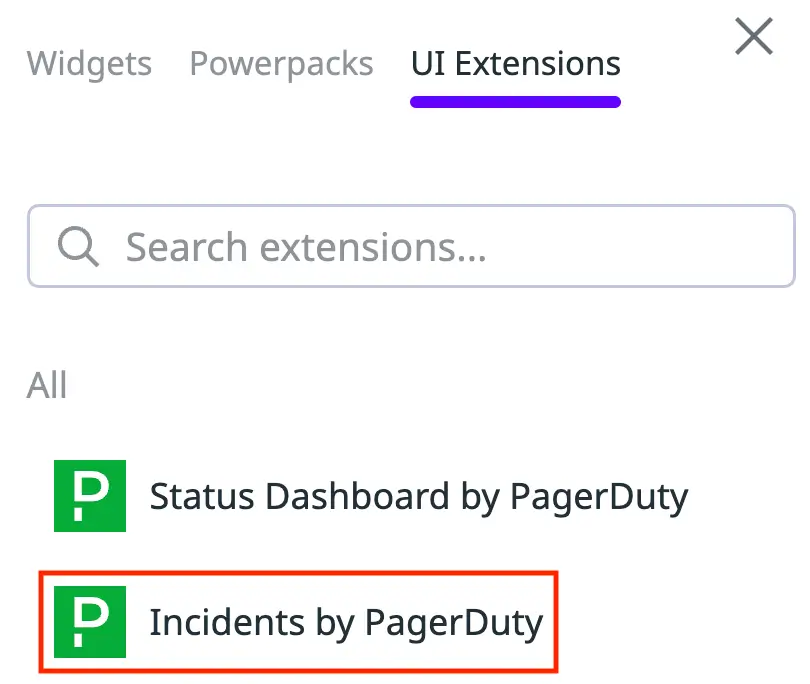
Incidents by PagerDuty
- In the Incidents by PagerDuty Editor modal, click Connect.
- Click Sign in to PagerDuty and complete the login process.
- You are redirected to the Editor modal where you see a preview of how the app appears. Configure the following field:
| Field | Value |
|---|---|
| Widget title | (Optional) Enter a title for the widget. |
- Click Save to add the app to your dashboard.
Using Incidents by PagerDuty
Incident Details in Datadog
Each incident in the Incidents by PagerDuty app displays the following information:
- Status: The status of the incident as Triggered, Acknowledged or Resolved.
- Priority: The priority level of the incident.
- Incident Title: The title of the incident, linked to view in PagerDuty.
- Service: The service of the incident, linked to view in PagerDuty.
- Escalation Policy: The escalation policy of the incident, linked to view in PagerDuty.
- Duration: The duration of the incident.
- Assigned to: The assigned responder of the incident.
- Outlier Incident: Context on how often similar incidents occur on a specific service. Note: This feature is only available to accounts with the Event Intelligence add-on, or those on the following pricing plans: Digital Operations (legacy) and Enterprise for incident management.
Acknowledge or Resolve an Incident
- Check the box to the left of the incident.
- Click Acknowledge or Resolve in the bottom menu.
View Incident or Service Details in PagerDuty
- Click the Incident Title or Service to view more details in PagerDuty.
- To view a list of all incidents in PagerDuty, click View all Incidents in the bottom right.
FAQ
Can I add two Status Dashboard apps with two different Status Dashboard views enabled?
Yes, as long as each Internal Status Page view is from the same PagerDuty account. Using two different PagerDuty accounts on the same dashboard is currently not supported.
Updated about 2 months ago