
Narrative Builder
Create detailed incident timelines for review meetings with the Narrative Builder
Jeli Part of PagerDuty
The Narrative Builder is designed to help you discover, organize, and share the story of an incident. It allows you to use primary data as evidence for your narrative, create an incident timeline, and develop a shareable visualization for incident review meetings.
By using Narrative Builder you will:
- Use event markers to indicate important moments of the incident.
- Add descriptive notes that offer additional color and insight into the incident.
- Quickly and easily attach evidence to event markers, so that those unfamiliar with the incident can follow along and learn.
- Create a rich, detailed timeline of what happened during the incident and highlight key events.
Narrative Builder
AvailabilityThe Narrative Builder is available with the Professional, Business, and Enterprise for Incident Management pricing plans.
Please contact our Sales Team if you would like to upgrade to a plan featuring Narrative Builder.
Build a Narrative
Import DataIf you haven’t already, use Slack to import incident data into Jeli using the
/jeli importcommand. You can also import data from additional Slack channels. Please read Slack Integration | Jeli for more information.
- Navigate to an Post-Incident Review in the Jeli web app by using one of the following options:
- Select a Closed incident and click Go to Post-Incident Review in the upper right.
- Or go to Post-Incident Reviews in the left menu and select your preferred Post-Incident Review.
- Select the report's Narrative tab:
- If you haven't started building the Narrative yet: A Build your Narrative modal will appear. Click Let's get started!
- If you've already started building the Narrative: Click Edit narrative to enter the Builder view.
This will be your main workspace as you identify incident events that you want to mark in your timeline.
Choose Supporting Evidence
- Evaluate Messages: In the Post-Incident Review Data section on the left, review your transcript line-by-line and ask yourself if each message is important to tell the incident's story. You should also check to see if each message fits within one of the event marker types:
| Event Marker Type | Suggested Questions |
|---|---|
| Detection | - How were we alerted? Where did we see this alerting and why was this brought to our attention? - Who knew at the beginning and how did they find out? - Who did they bring in and how did they know to do this? - What background information did they have on this topic? |
| Diagnosis | - What were responders looking at and why? - What did the problem mean? What was the impact? - What did people think was happening? - What did they try to do? What tools did they use for this? - How did they communicate this with each other? |
| Repair | - What were some possible solutions to the issue? - How did responders arrive at this solution? What constraints did they have? - How did they confirm if the solution worked or didn’t work? |
| Key Moment | - How did responders collaborate? - Was anything confusing? - Did the communication methods change? - Did they share information with outside parties? - Did people learn something new? |
Please read Event Markers for more information.
-
Organize Messages Under Event Markers: To add a message to an event marker, select the checkbox to the left of the message and select an event marker from Narrative section on the right side of the screen.
- You may include multiple pieces of evidence under the same marker if they all relate to the same point. When choosing an event marker, read the messages around it.
- If multiple messages explain what is happening during that part of the story, they should be included as well.
-
Add Supplemental Evidence: You can also add evidence from outside of Slack messages by clicking Add supplemental evidence when entering an event marker's details. Here you can add images, links, or text to offer additional context to the incident's story. This might be screenshots of graphs, links to a specific query, or a copy-and-paste of relevant logs.
TipAs a general rule, we recommend using multiple pieces of evidence under a single marker if you can summarize what is happening within two sentences. Any more is a signal that you may want to break it out into separate markers. For example: A conversation about a team deciding to revert a change may include multiple messages as supporting evidence under the same Repair Marker.
Update Event Marker Details
- Incident Start and End Time: After you’ve added supporting evidence to the narrative, you may update the Incident start and end times. The Incident Start and End Times are automatically generated based on the first channel ingested into the Post-Incident Review. To change this information, click , select a new date and time, and click OK.
- Write a Summary: Update the Summary field with a few sentences describing what is happening in the supporting evidence. For example, "SREs and Software Engineers decide to move forward and revert the change made earlier in the day".
TipWe recommend using plain language, as if you are telling the story of what happened to a coworker or in an incident review meeting.
-
Add Notes (Optional): We recommend using the Notes section to ask any questions that arise based on the supporting evidence. Even if you think you know the answer, if something is unclear it is helpful to ask it during the review meeting so others can learn from it.
-
Click Done to save your marker.
-
Add More Markers to Help Tell Your Story: You can choose as many markers as you need to tell your story. You do not have to go in a linear detection-diagnosis-repair manner, either. Your focus may jump forward or backward as more information becomes available.
For example, halfway through the repair phase you may discover that another component is impacted, and another team's expertise is needed to progress with the investigation.
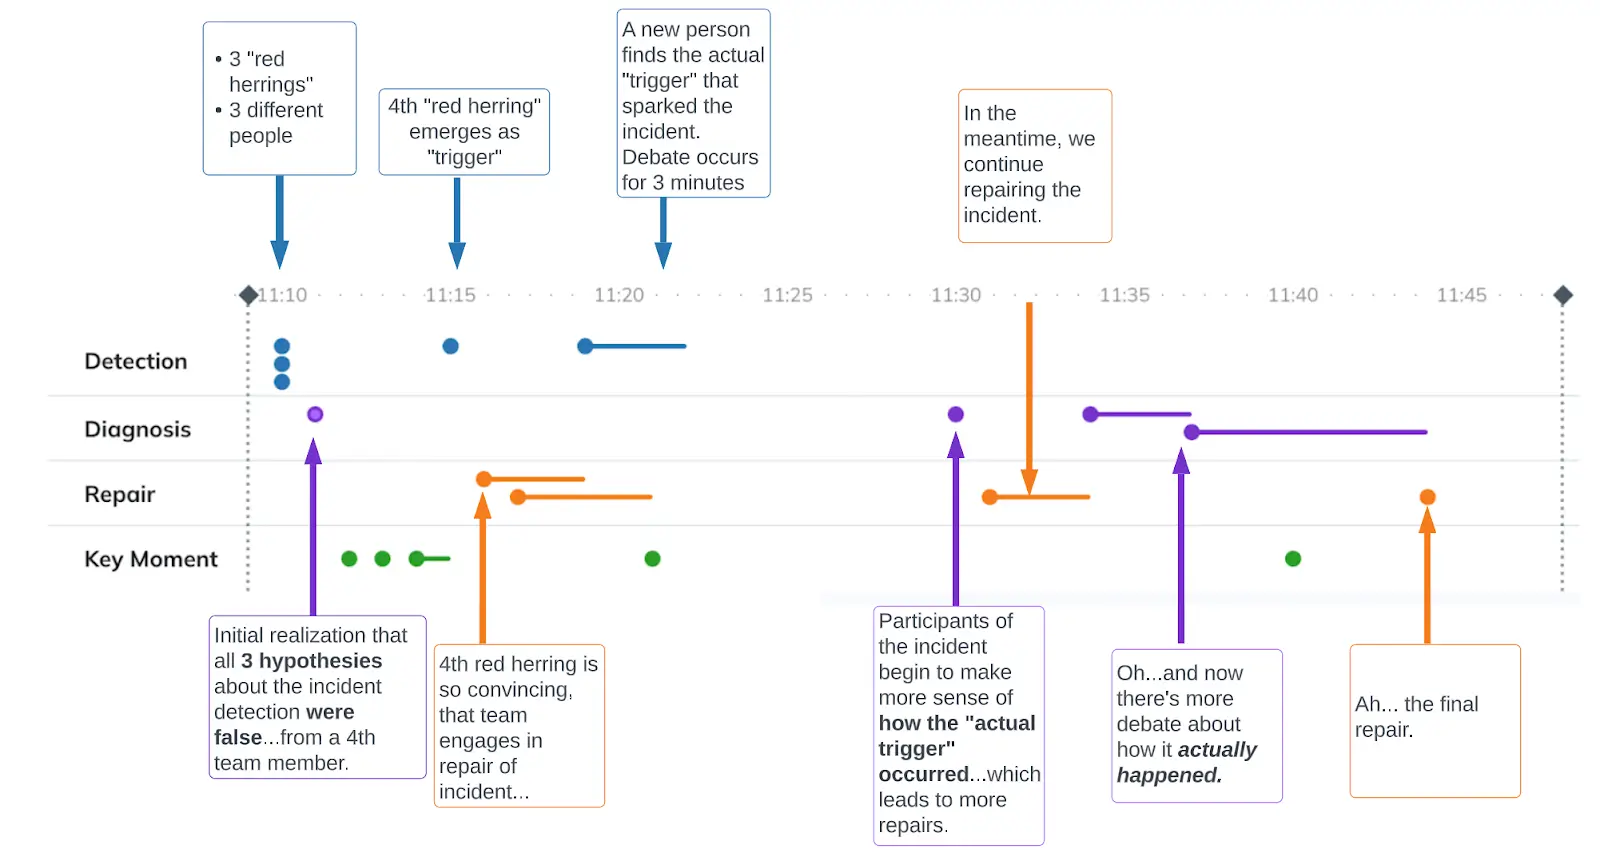
The following example highlights rich insights associated with each marker:
Narrative view
Finish Your Narrative
- Once you have finished adding and/or editing event markers, you can click Close Builder at the bottom center of the screen. You will be able to see the narrative timeline visualization as well as a list of event markers below. You may now use your narrative in the next step of your incident analysis process. We recommend using it to set your incident review meeting's agenda. Please read Basic Post-Incident Review Tutorial for more information.
Narrative view
Edit or Delete an Event Marker
While building your narrative, you may need to edit or delete a marker.
Edit an Event Marker
To edit an existing marker:
- Navigate to your preferred Post-Incident Review, select the Narrative tab and click Edit narrative.
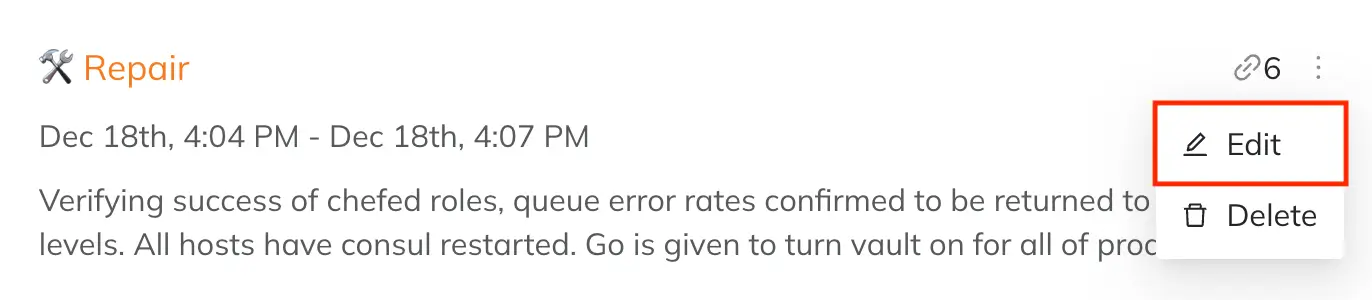
- Hover over the menu next to a marker and select Edit. 3. Make your desired changes and click Done.
Edit narrative marker
Delete an Event Marker
- Navigate to your preferred Post-Incident Review, select the Narrative tab and click Edit narrative.
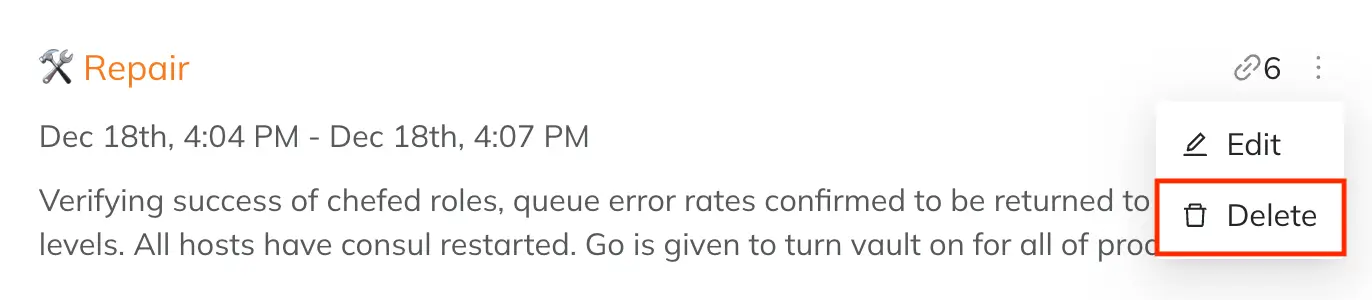
- Hover over the menu next to a marker and select Delete.
- In the confirmation modal, click Delete marker.
Delete an event marker
Narrative Builder Components
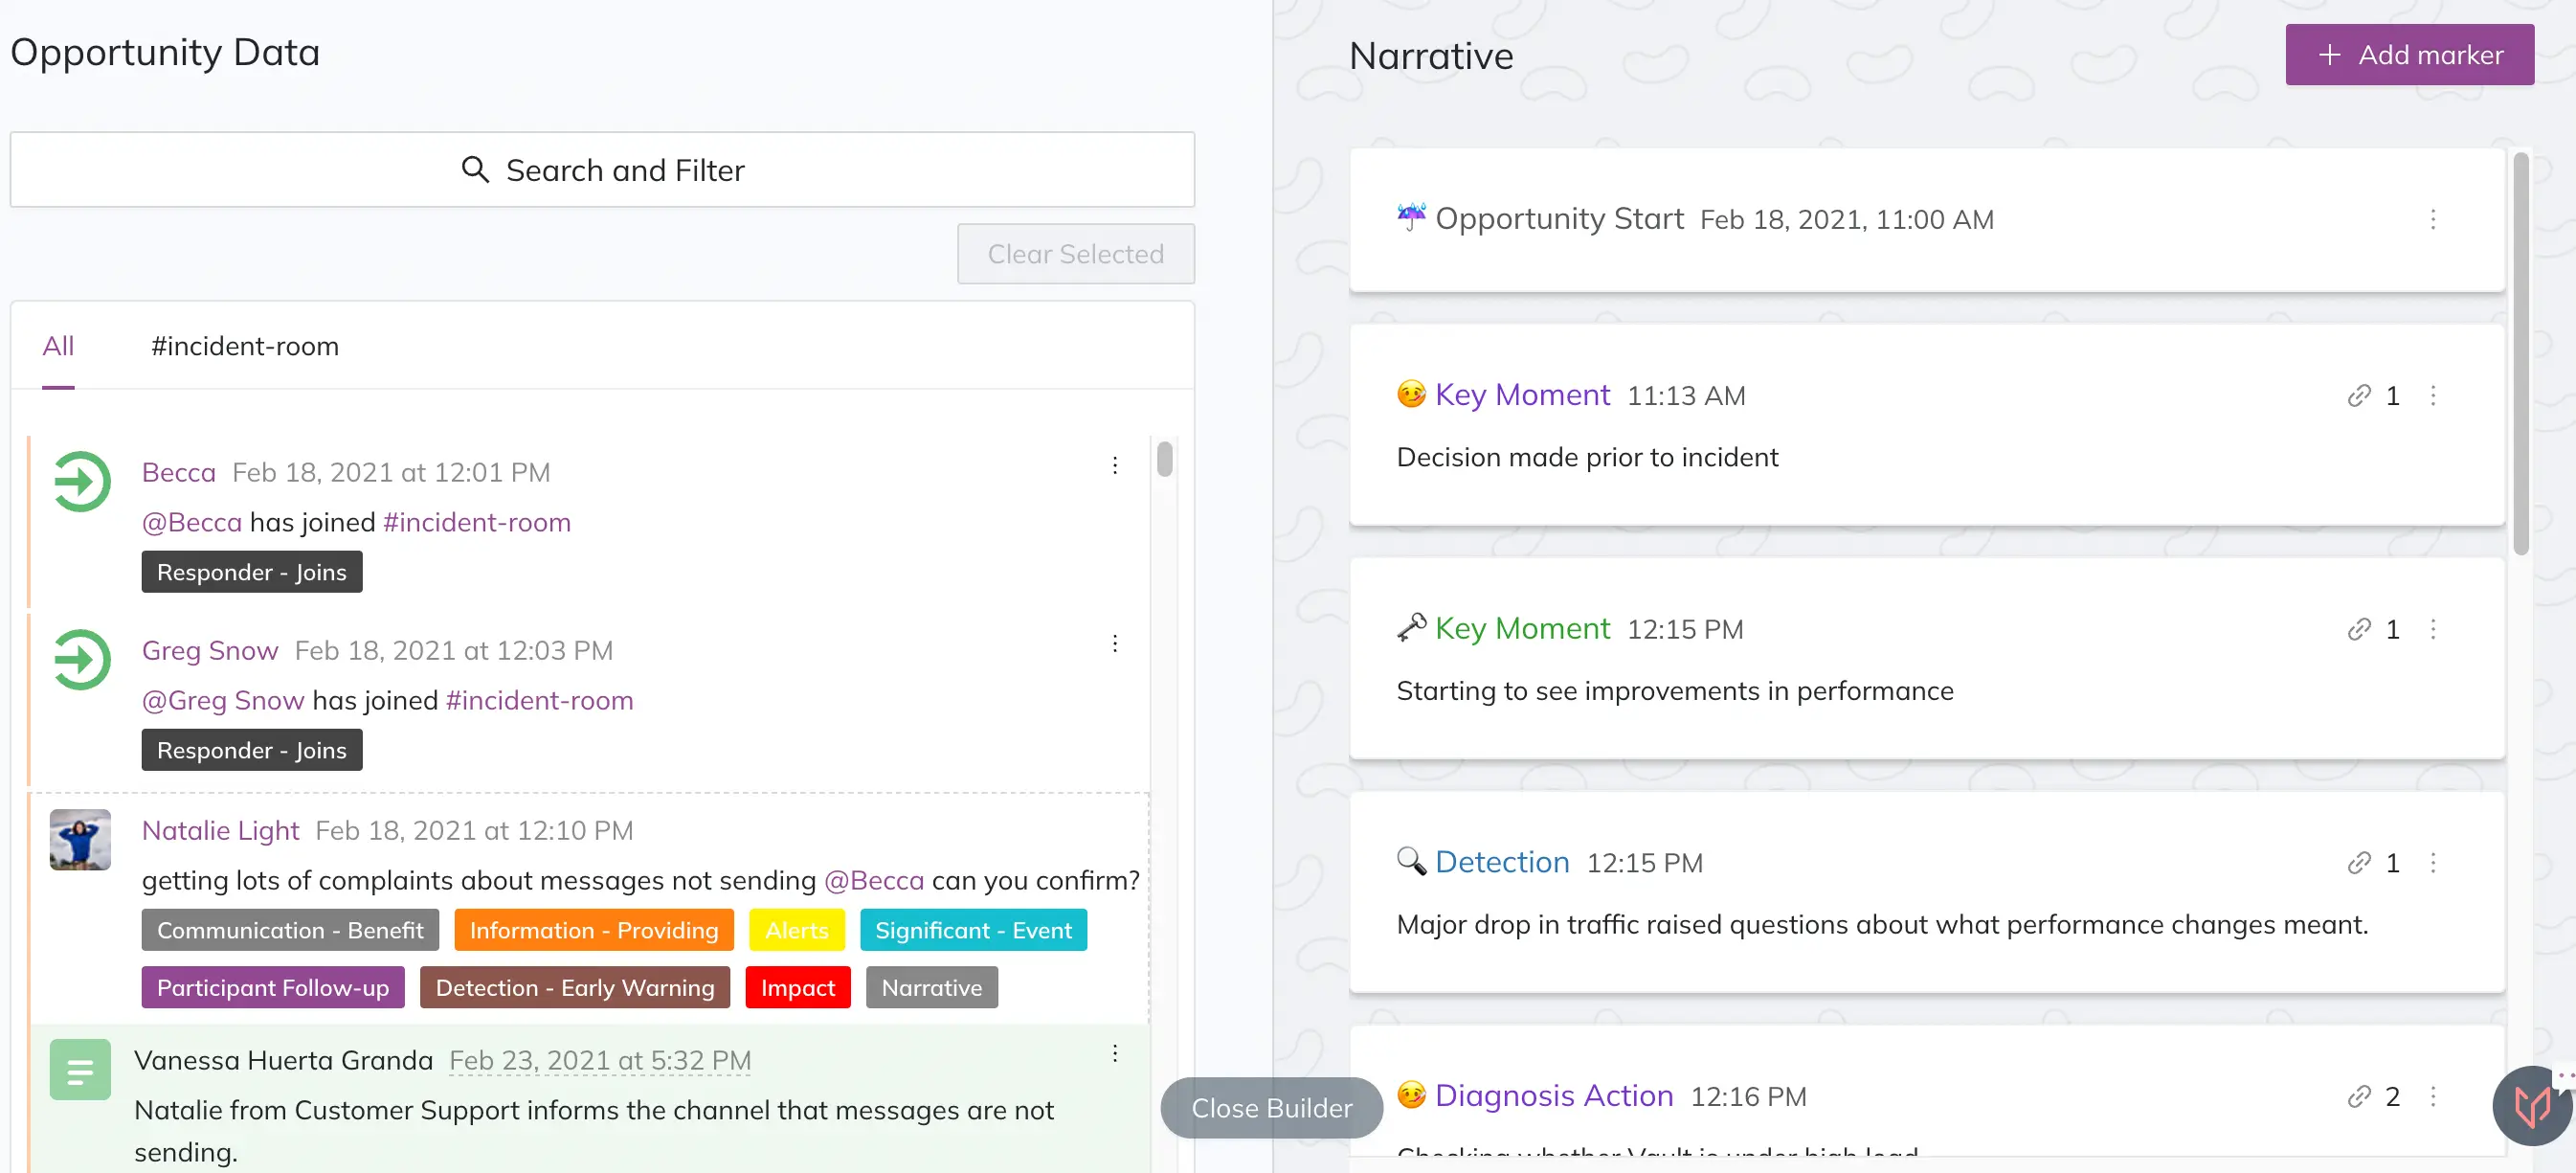
The Builder view is split into two side-by-side panes with imported Slack channels and Post-Incident Review data on the left, and your working narrative timeline with event markers on the right.
-
Post-Incident Review Data contains message logs from imported Slack channels with search and filter options to help you find the messages that marked different events throughout the incident.
-
Narrative Timeline is where you create and flesh out event markers, add summaries, notes and pull in supporting evidence from messages you find in Post-Incident Review data. The event markers you create build out the story of the incident and make up the visual timeline you see at the top of the presentation view.
TipA helpful approach to narrative building is to think of the Post-Incident Review data as the pieces of a puzzle, and the narrative timeline as the canvas where you piece them together to form the bigger picture of the incident.
Post-Incident Review Data and Narrative
Event Markers
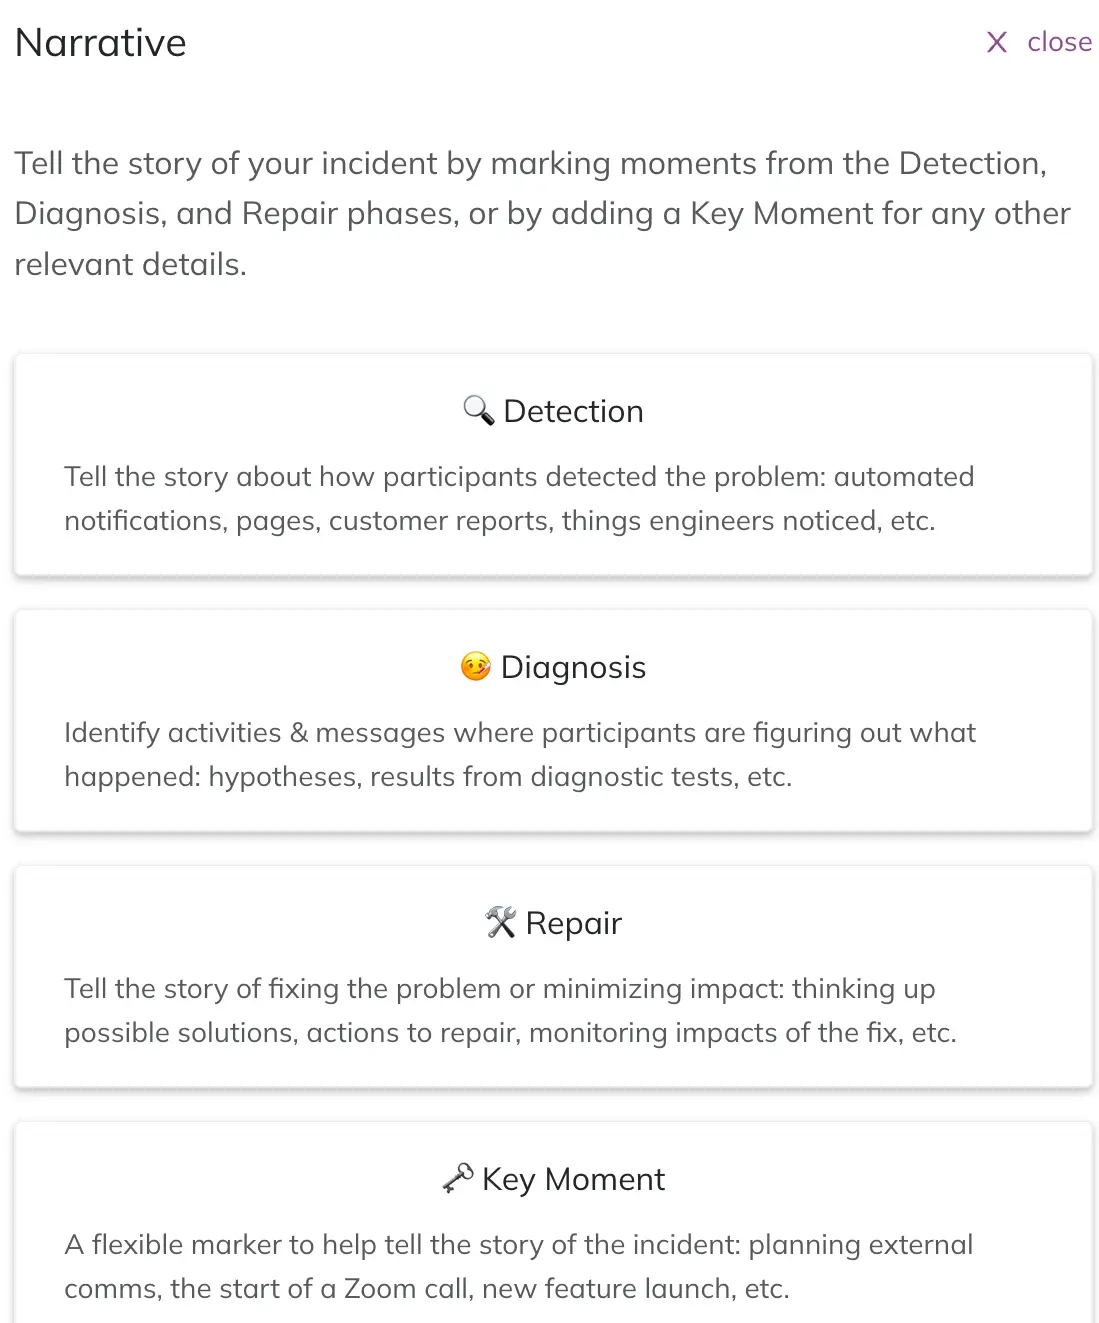
Event markers are the points along your Narrative timeline that compose the story of your incident. There are four types of event markers:
| Event Marker | Description |
|---|---|
| Detection | Tells the story about how participants detected the problem, for example automated notifications, responder notifications, customer reports, etc. |
| Diagnosis | Activities and messages where participants figured out what happened: tracking hypotheses, results from diagnostic tests, sharing dashboards and graphs, etc. |
| Repair | Tells the story of how the problem was fixed or impact was minimized: brainstorming solutions, actions taken to repair, monitoring impacts of the fix, etc. |
| Key Moment | Flexible in definition and use. These event markers help tell the story of the incident and denote various changes during incident response: planning external comms, starting a Zoom call, a new feature launch, etc. |
Event markers
To add an event marker use the + Add marker button in the top right hand corner:
Add an event marker
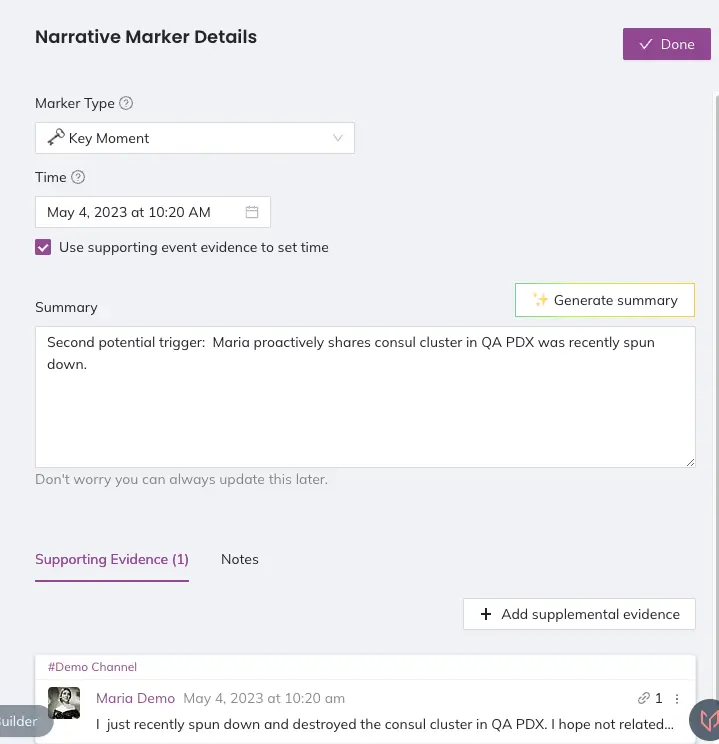
Within each event marker you can add a summary, supporting evidence, notes, and the time of the event.
- The Summary is where you will describe the nature of the event. What makes this important, or how does it change the story of the incident?
- Note: This is the primary information that is displayed for each event marker in the timeline view.
- Supporting Evidence is where you link relevant Slack messages to the marker. You can drag them from the Post-Incident Review data side of the screen directly into the marker. Supporting evidence for the earliest detection marker in your timeline might be an exchange of messages in a public engineering channel asking about a confusing dashboard, or a single ping in an alerts channel.
- Drag and drop events directly into a narrative marker under Supporting Evidence in the Narrative Marker Details panel. This will add them as evidence within the marker.
Add supporting evidence
- Add Supplemental Evidence: You can also add evidence from outside of Slack messages by clicking Add supplemental evidence. Here you can add images, text, and links to add context to the story of the incident. This might be screenshots of graphs, links to a specific query, or a copy and paste of relevant logs.
Add supplemental evidence
- Notes are your workspace to track questions, log insights, and gather thoughts. You can also edit notes from the timeline view, so that you can update or add new information while running interviews or a review meeting, for example.
Add notes
- The time can be set manually to the second. It is in 24-hour time in your local timezone. For each event you can set a single time, or add an end time to indicate the duration of the effort depicted by this event marker.
- You can also check the box Use supporting event evidence to set time to automatically set a marker's timeframe using the time of your events under Supporting Evidence.
- In the timeline, event markers are represented as a single point in time. If you add an end time to an event, it will show as a continuous line for the duration of the event’s timeframe. If you leave the time blank, the event marker will fall at the end of the narrative timeline and will not be a visual point on the timeline display.
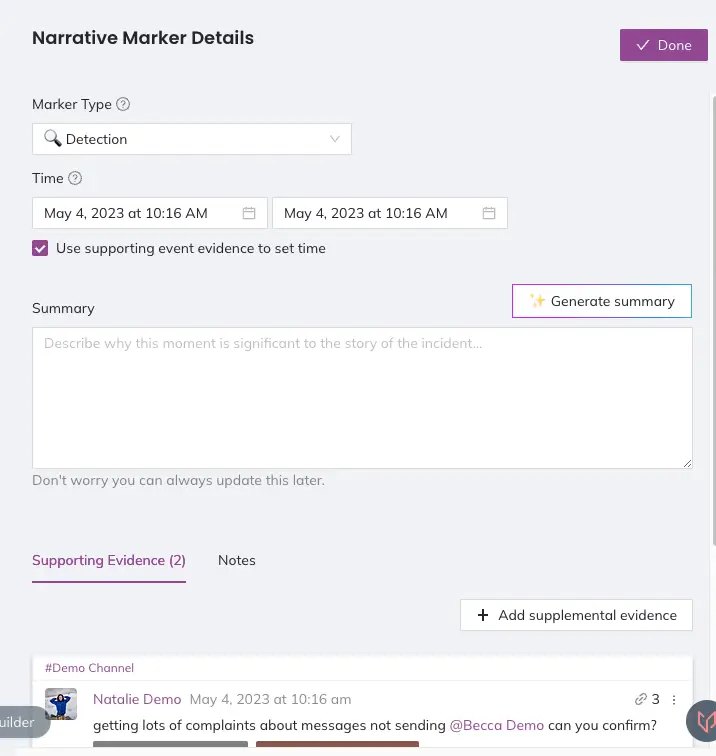
Narrative marker details: Detection
You can edit any of the fields in an event marker from the builder at any time. If you realize the supporting evidence and notes you have added suggest a different type of event marker, you can select a different one from the Marker Type dropdown.
Narrative marker details: Key moment
When starting a new investigation, the narrative timeline will show two event markers by default: Opportunity Started and Opportunity Ended. These markers' times are set automatically based on the timeframe of the imported Slack messages, but can be customized. These events cannot be deleted or changed to other event marker types.
Search and Filter Post-Incident Review Data
In the Post-Incident Review Data section you can search for keywords and phrases, and filter your data by Participants, Reactions, Event Source, and Tags.
- Participants are the responders who engaged in the imported Slack channels during the incident.
- This is a helpful filter when you are looking for messages or conversations between specific individuals.
- Reactions are the emojis or reactjis used in response to Slack messages.
- Filtering by reaction can be a useful shorthand for finding relevant moments in the story of the incident. Every company has its own culture of Slack reactions; you may have common ones used to indicate important information, interesting questions, or celebrating successes.
- Event Sources are the channels imported from Slack, and PagerDuty, if your account has that integration configured.
- This filter is good to add to a search or other parameters to narrow results to a specific channel or to look for a distinct PagerDuty notification.
- Tags are metadata you can add in the Event Data view to associate additional context with a message.
- The Responder Joins tag is automatically added for each new participant who joined the Slack channel. This is helpful for getting a feel for how and when people joined the incident. All other tags are applied through the Event Data view in Jeli.
You can combine searching for a keyword or phrase with multiple of the filter types above to help narrow down your search results.
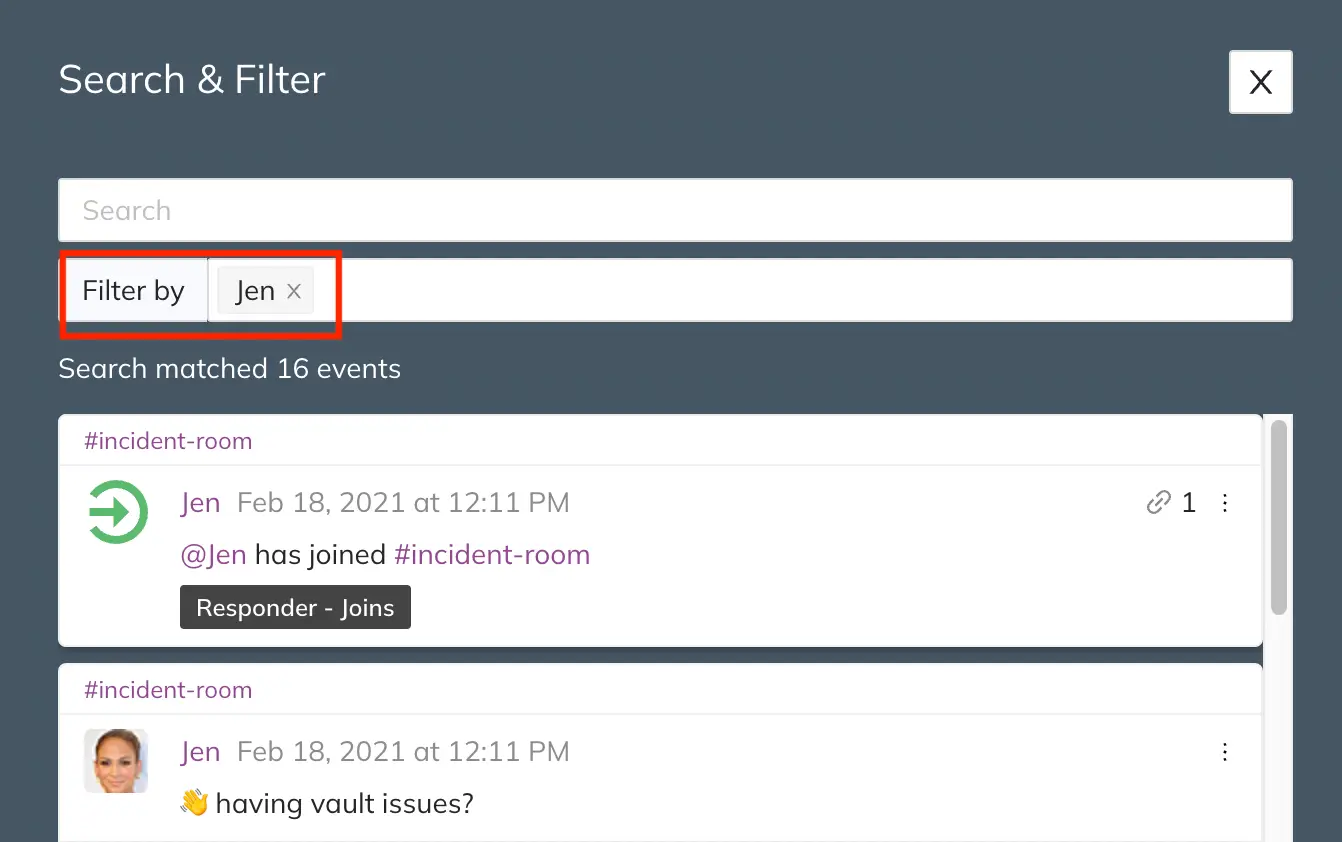
Filter search results
In addition to searching and filtering, if you imported multiple Slack channels, you toggle between messages from all channels (default) or individual channels.
As you search and filter to uncover the incident story, you may wish to review a message in its original context. There are two options for this: Jump to log and View in context:
- Jump to log takes you to the message in the original message log, removing all applied searches or filters.
- View in context opens the original message log on the left-hand side of the screen, preserving your search and filtered results on the right hand side of the screen.
View the Narrative Timeline
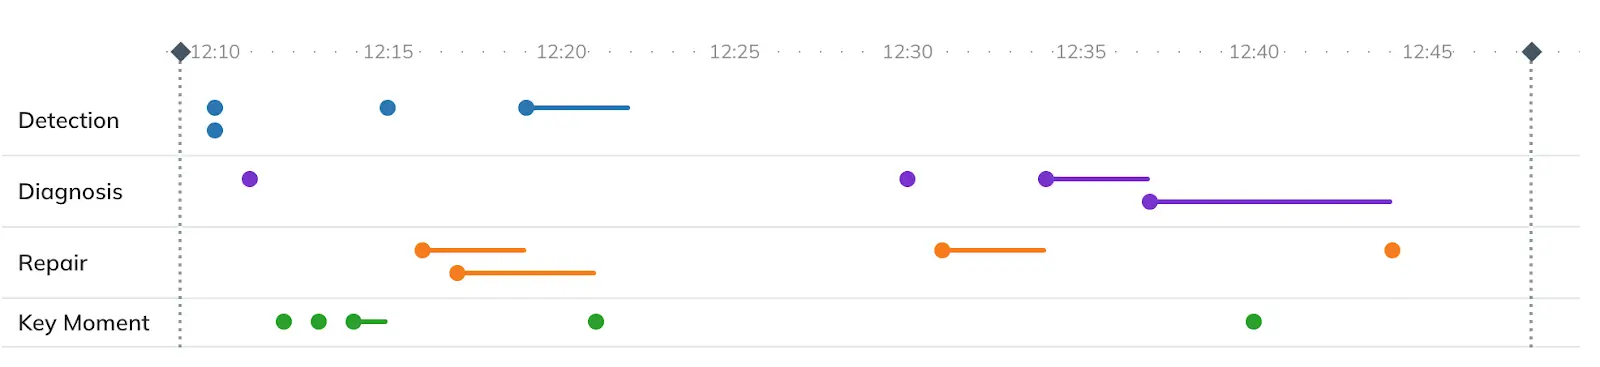
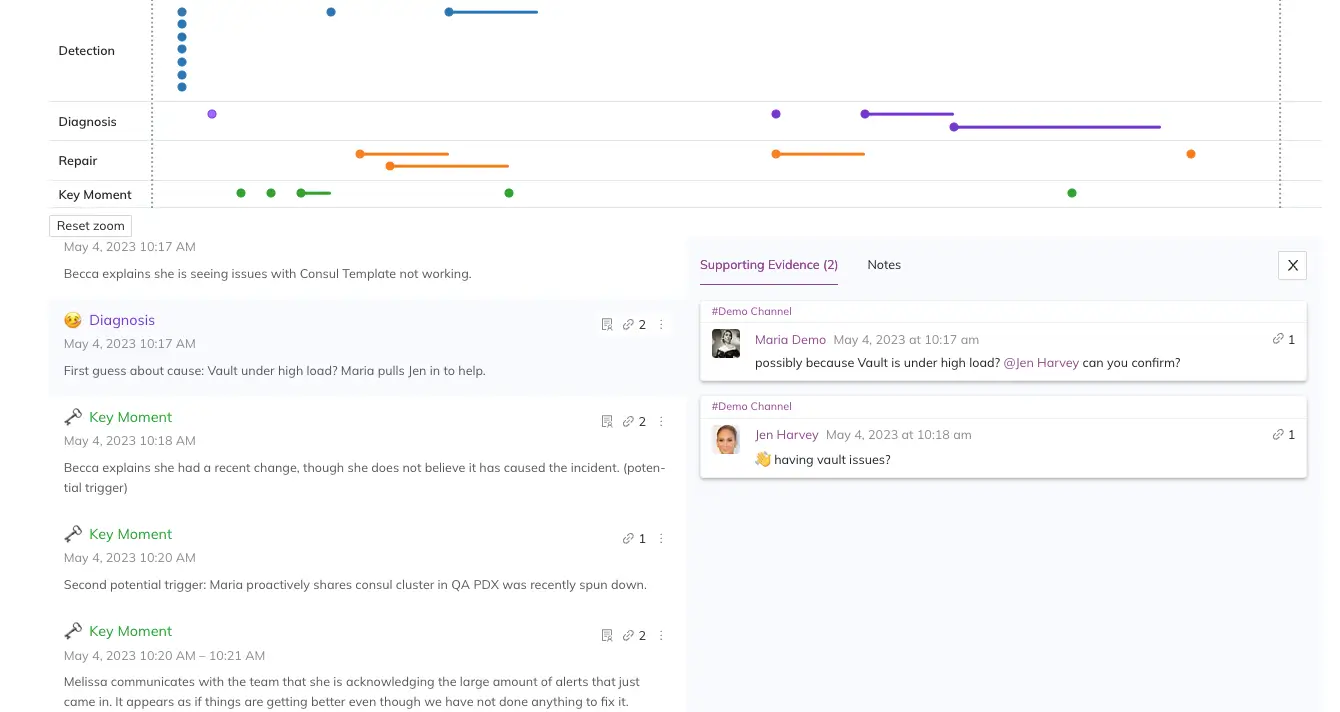
To the view Narrative timeline, in the Jeli web app select your preferred Post-Incident Review and navigate to Report Narrative. The Narrative timeline displays all of an incident's event markers, along with their summaries, in chronological order, including its start and end times. Any event markers created without a set time will be displayed at the bottom.
You can open any of your event markers and see any attached supporting evidence, including the data source and timestamp. You can also see any attached notes, and edit them from the timeline view.
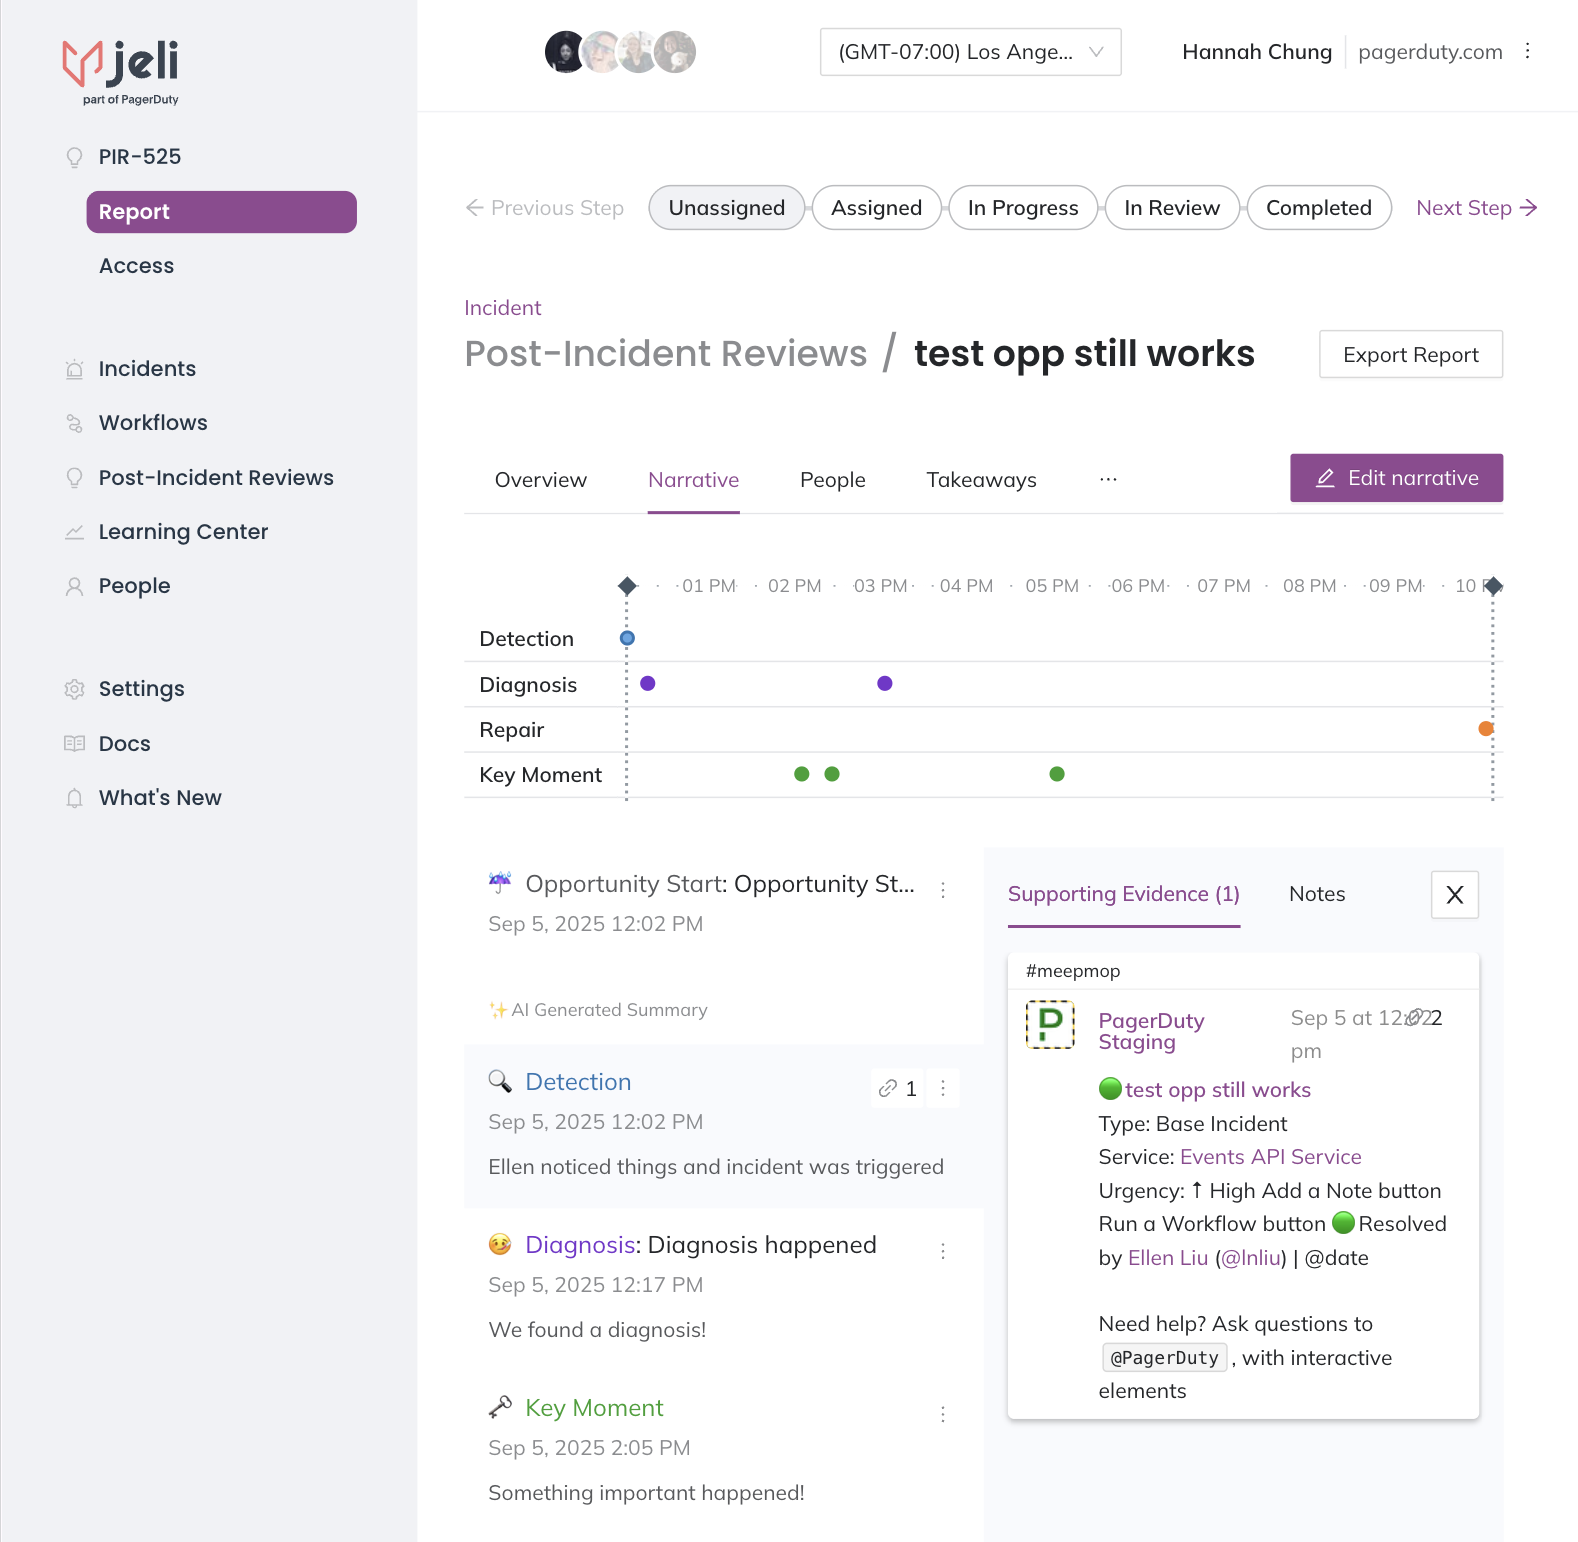
Narrative timeline with event markers and supporting evidence
Timeline Zoom
Click-and-drag over your desired timeframe to zoom in on a particular part of the timeline. This is helpful if you'd like take a closer look at a point in time that:
- Was particularly interesting.
- Presented a red herring.
- A key moment occurred.
- Is critical to understanding the Post-Incident ReviewPost-Incident Review.
Click Reset zoom to go back to the default zoom level.
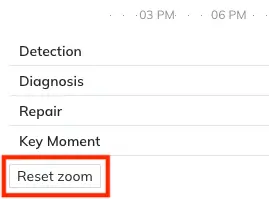
Reset zoom
Present Using Narrative Builder
The Narrative Builder makes it easy to run your post-incident meeting. By sharing your screen you can navigate the timeline view and talk through the markers that you've made, as well the supporting evidence. You can also see your notes that you've made as part of each marker and update them on the screen as you learn new information from attendees, or uncover new questions or insights.
Edit NotesAt this time, only one person can edit the notes section at a time.
Narrative Builder
Updated 13 days ago