
Business Impact Insights
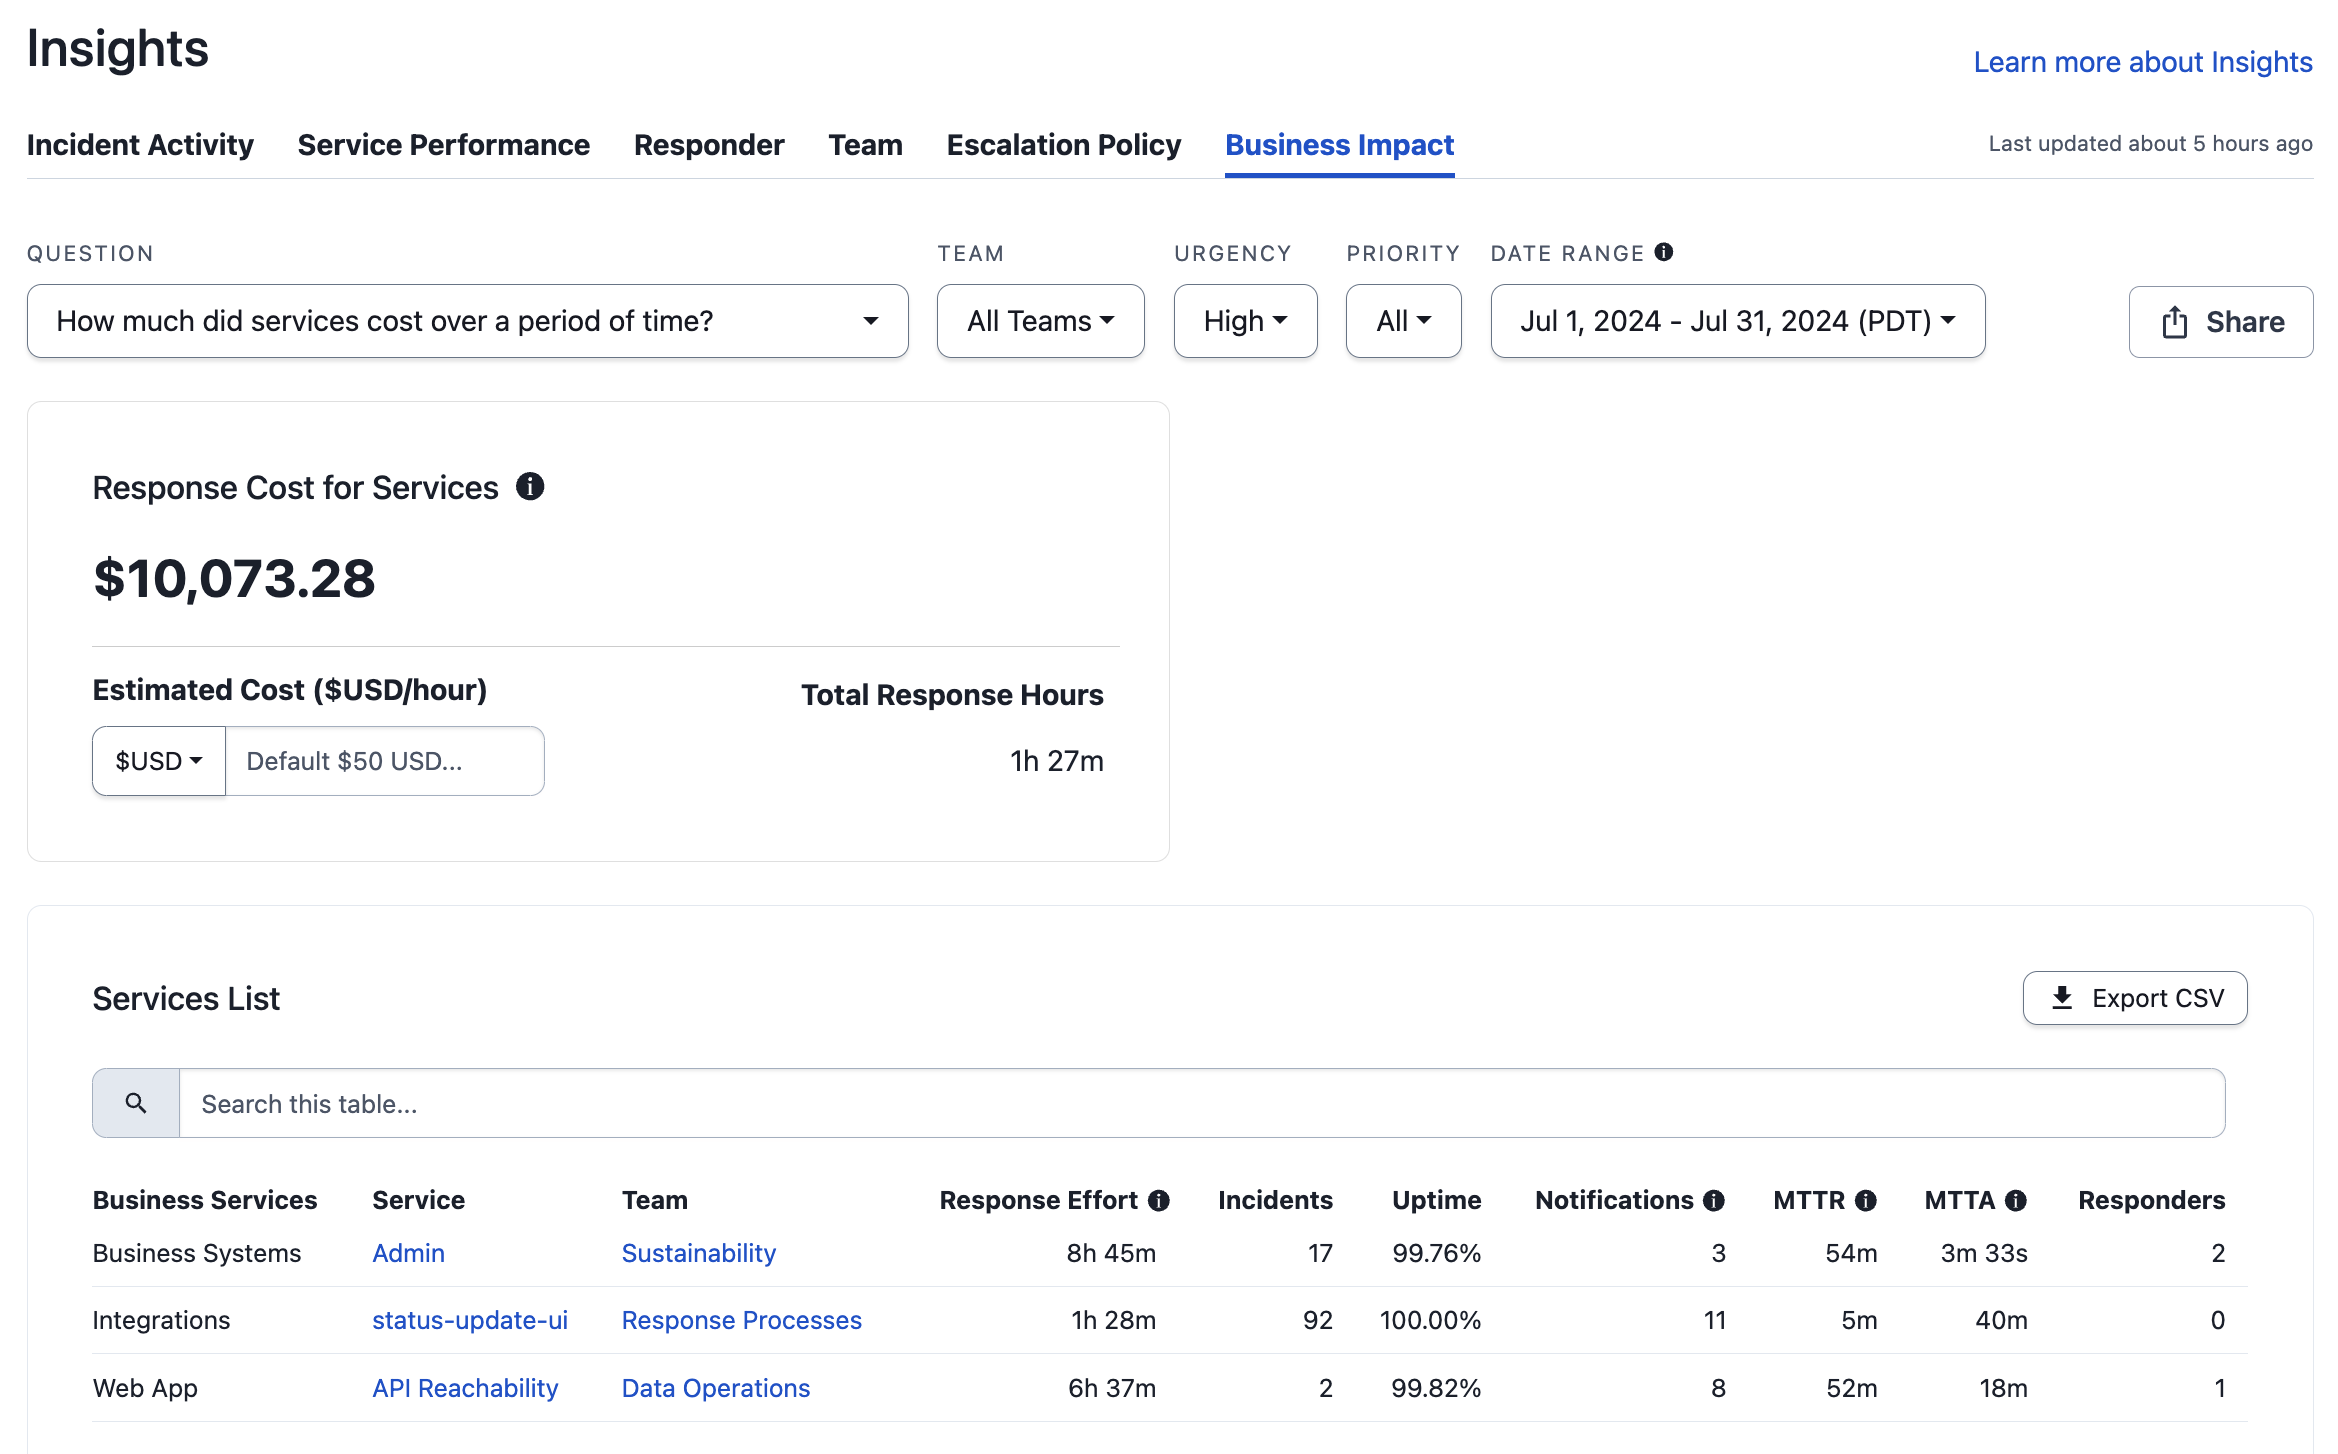
The Business Impact report provides insights into how much services cost over time. It also includes a Services List with metrics such as response effort (incident duration), uptime percentage, MTTR, and MTTA.
To view the Business Impact report, navigate to Analytics Insights Business Impact tab.
Business Impact Report
Filter and Search Business Impact
Filter Options and LimitsPlease see our Filter Reports section for more information on filtering options.
Each report has the following filter limits:
- Service, Responder, and Escalation Policy Filters: 1000
- Team Filter: 200
Please see our Filter Limits section for more information.
Response Cost for Services
The Business Impact tab provides you with insights on the estimated response cost for your selected Teams and services. By default, the estimated cost per responder hour is set to $50. If you would like to change your estimated cost per responder hour, you can enter that in the Estimated Cost ($/hour) field and a new total value is calculated based on that cost and the Total Response Hours.
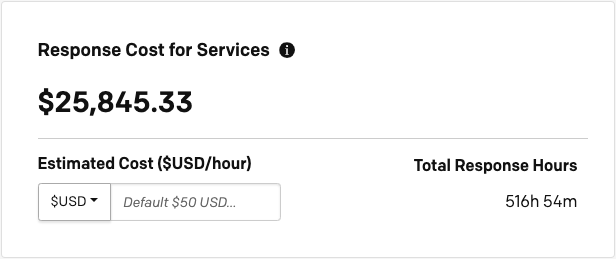
Response Cost for Services Estimate
Services List Table
Below the Response Cost for Services table you see the Services List data specific to the filters you have selected. You may perform the following actions with this table:
- Search: Use the search field to search for specific data.
- Sort: Click on a column header to sort results. You can also sort with multiple columns by holding down the shift key while clicking on both of the columns.
- Drill Down: Click a service or a Team in the Service or Team columns to view more information about each.
The available Services List columns are:
| Column Name | Description |
|---|---|
| Business Services | The Business Service(s) mapped to each service. |
| Service | The service name. |
| Team | The Team each service belongs to. Teams allow users to group and control user access to associated PagerDuty objects, such as escalation policies, users, schedules, and services. |
| Response Effort | The total engaged time across all responders, measured from the time a responder acknowledges or accepts a responder request until the incident is resolved. |
| Incidents | The total count of incidents that occurred on the service within the specified time period. |
| Uptime | The inverse of the time (in %) during which the service had an active major incident. A major incident is defined as the top two levels of your priority settings, or if multiple responders are added and acknowledge. |
| Notifications | The total count of incident notifications sent via push, email, phone call, and SMS. |
| MTTR | The average time from when an incident was created until it was resolved. |
| MTTA | The average time between when an incident is first assigned to a user and when the incident is first acknowledged by that user. Reassign, resolve, and escalation actions do not imply acknowledgement. |
| Average Engaged Responders | The average number of responders engaged in an incident. |
By default, the Services List displays 10 results at a time. Use the dropdown below the table to select from 10, 20, 30, 40, or 50 results per page. If there are more results than the selected dropdown value, you can use the arrows (i.e., , , , ) to navigate through results.
Share the Business Impact Report
Read Share a Report below for more information on sharing or exporting the report.
Updated 23 days ago