
Operational Reviews
Facilitate operational review meetings with team, service and company operation metrics
Operational Reviews
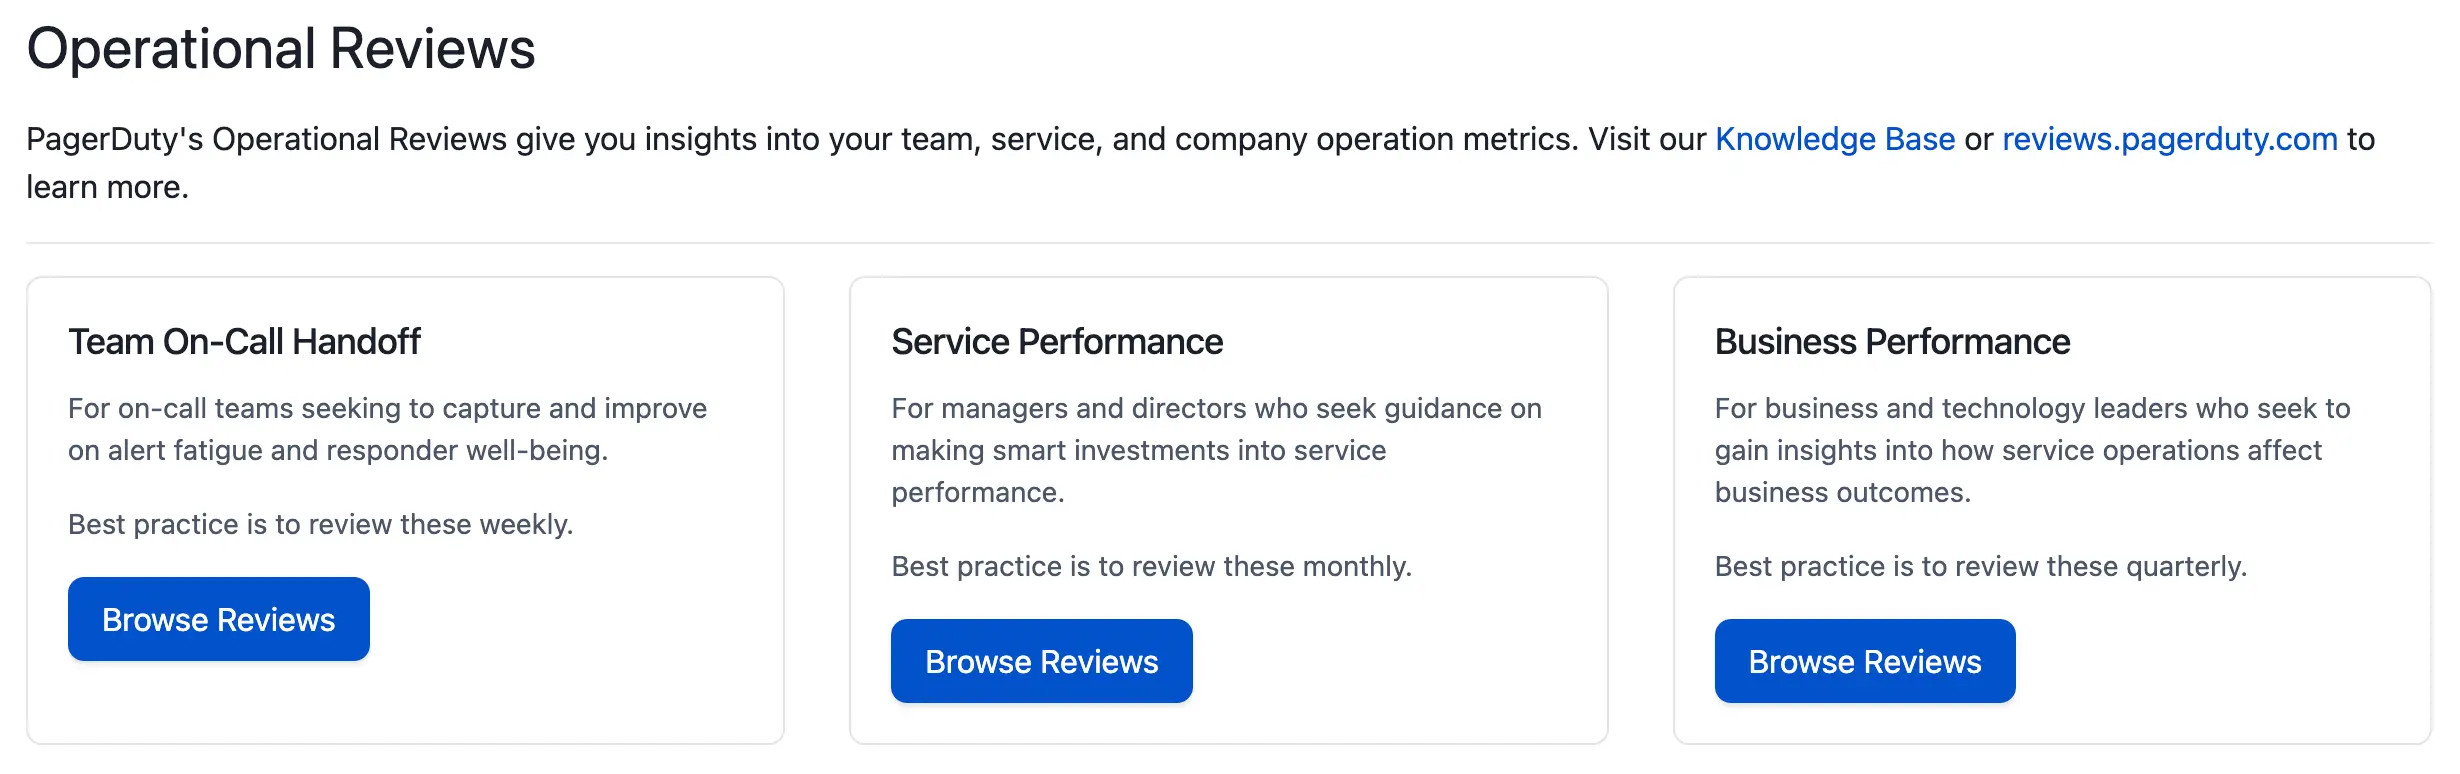
The Operational Reviews feature offers metrics for three types of reviews, each targeted at different levels of leadership in a digital business. These review types facilitate weekly, monthly, and quarterly operational review meetings:
These reviews analyze past performance and are not designed for ad-hoc or real-time analytics needs. For in-depth background information on Operational Reviews, read the Reviews Guide.
Navigate to Operational Reviews in the web app at Analytics Operational Reviews.
Operational Reviews menu
InfoThe Operational Reviews feature is included on the following pricing plans:
- Business
- Digital Operations (legacy)
- Enterprise for Incident Management
Contact the Sales Team to upgrade your plan and access this feature.
WarningAll users, except those with Restricted Access and Limited Stakeholder roles, can view and manage Operational Reviews.
Foundational Concepts
Each review incorporates interruptions and major incidents.
Interruptions
Interruptions occur when an on-call responder receives an SMS (text), mobile push, or phone call notification, and when an incident sends out a unique count of notifications. The same type of notification sent from various channels (SMS, push, phone call) to the same destination counts as one interruption. Email notifications are excluded, as email is not considered an interrupting channel.
- Business Hours Interruptions (Color Signifier: Yellow): The count of interrupting notifications sent between 8am and 6pm Monday to Friday, in the user's local time.
- Off Hours Interruptions (Color Signifier: Orange): The count of interrupting notifications sent between 6pm and 10pm Monday to Friday, or all day over the weekend, in the user's local time.
- Sleep Hours Interruptions (Color Signifier: Red): The count of interrupting notifications sent between 10pm and 8am, in the user's local time.
Major Incidents
A major incident is any high-priority incident that requires a coordinated response, often across multiple teams. Major incidents are typically highly visible to customers, making resolution the highest priority. Most organizations refer to major incidents as P1, P2, or SEV-1, SEV-2. In PagerDuty Analytics, major incidents are defined as the top two levels of your priority settings, or incidents where multiple responders have been added and have acknowledged the incident. Anyone who accepts a request to join the incident, acknowledges the incident, or reopens it is included in this count. In the Business Performance Review under Major Incident Details, these designations appear in the upper left as pills labeled P1, P2, SEV-1, SEV-2, or MRI for Multiple Responders Involved.
Review Configuration
When you first enable the Operational Reviews feature, reviews automatically generate based on your account's team data — you do not need to manually create them. If the feature was just enabled, reviews may not appear until PagerDuty has analyzed your account's performance data, which can take approximately one hour. If no reviews appear, ensure you are a member of at least one Team so they can generate.
InfoOperational Reviews data only creates reviews for teams that were present in the account at the time of enablement. Teams created after enablement do not generate reviews automatically.
Each user has a unique default review based on their team membership, and you can subscribe or unsubscribe from reviews assigned to you. To view reviews for a team you are not on, you must join that team or create a custom review that covers the team with your desired data.
Default reviews generate on the following schedule:
- Team On-Call Handoff Reviews generate every Monday morning.
- Service Performance Reviews generate on the first of every month.
- Business Performance Reviews generate on the first of every calendar quarter.
- Custom reviews generate on the cadence set when they were created.
Show All Reviews
- Navigate to Analytics Operational Reviews and click Browse Reviews under your desired review type.
- Check the Show all reviews (including unsubscribed and archived) checkbox to view reviews you are not currently subscribed to.
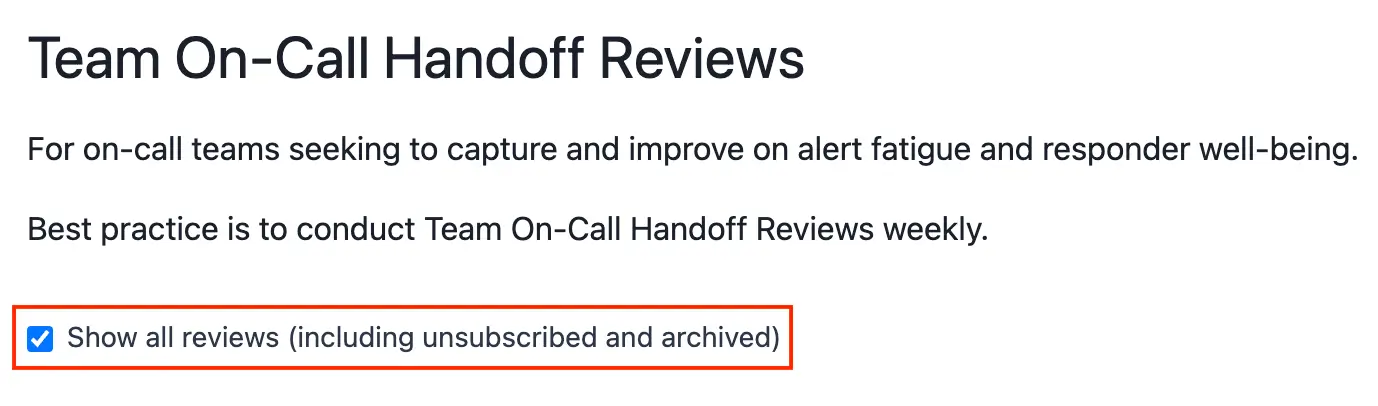
Show all reviews checkbox
Subscribe or Unsubscribe From a Review
- Navigate to Analytics Operational Reviews and click Browse Reviews under your desired review type.
- Complete one of the following:
- To subscribe to a review: Check the Show all reviews (including unsubscribed and archived) checkbox, search for the desired review, and click Subscribe on the right side.
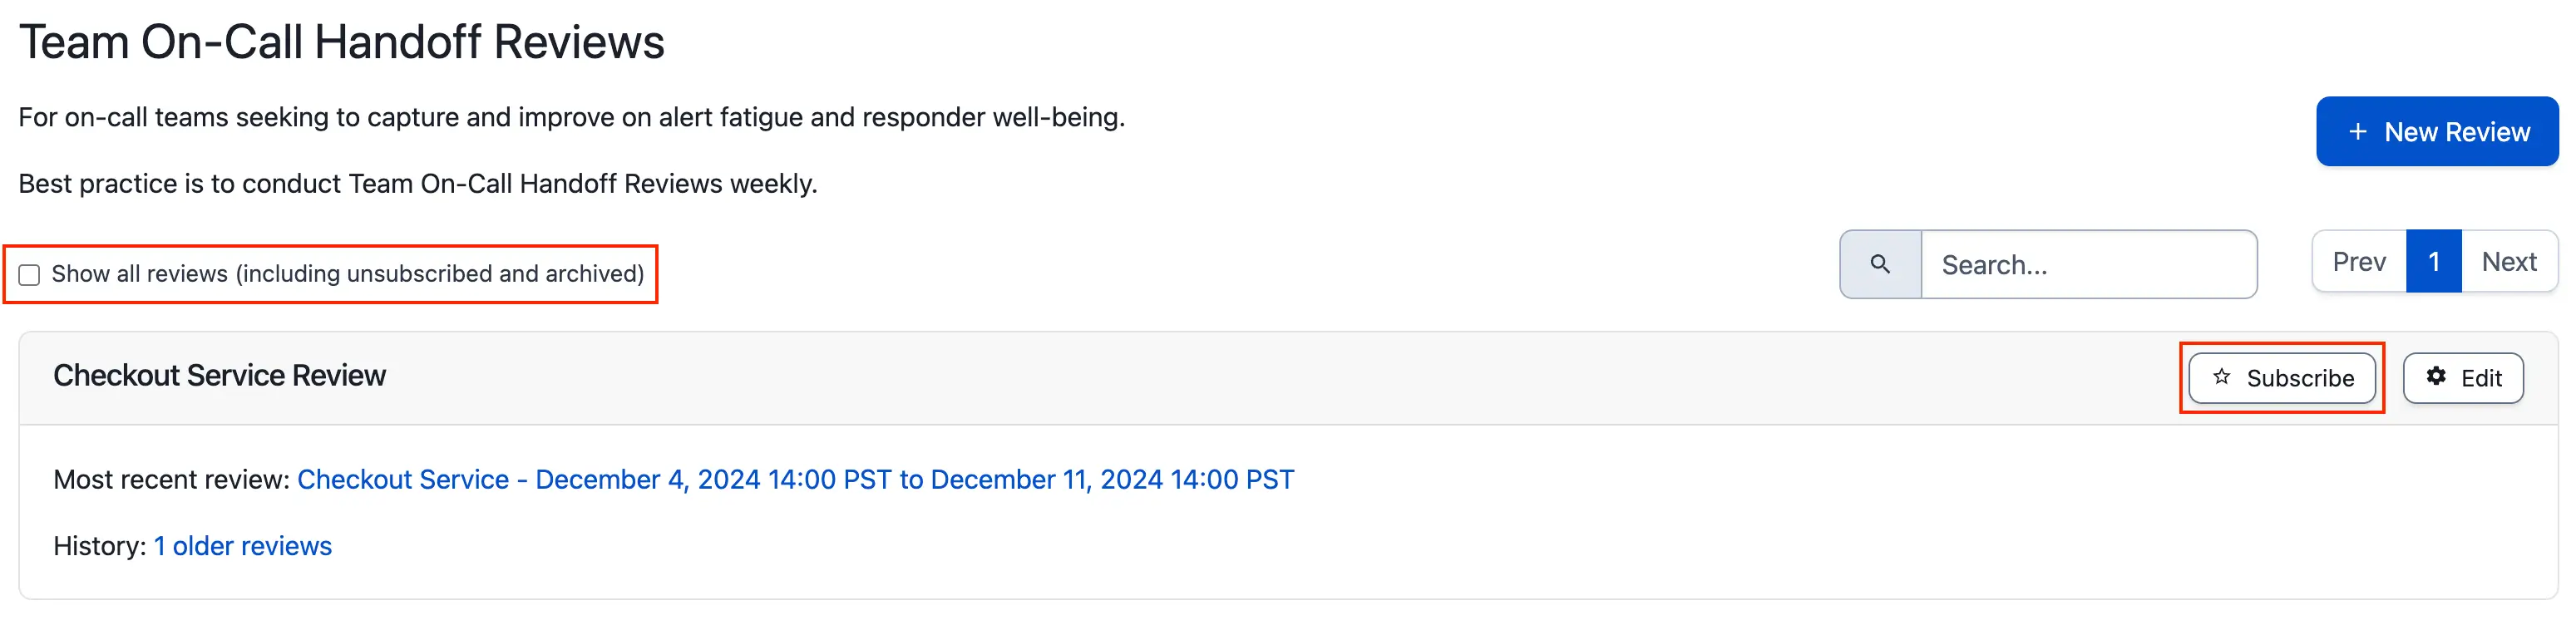
Subscribe to a review
- To unsubscribe from a review: Search for the review and click Unsubscribe on the right side.
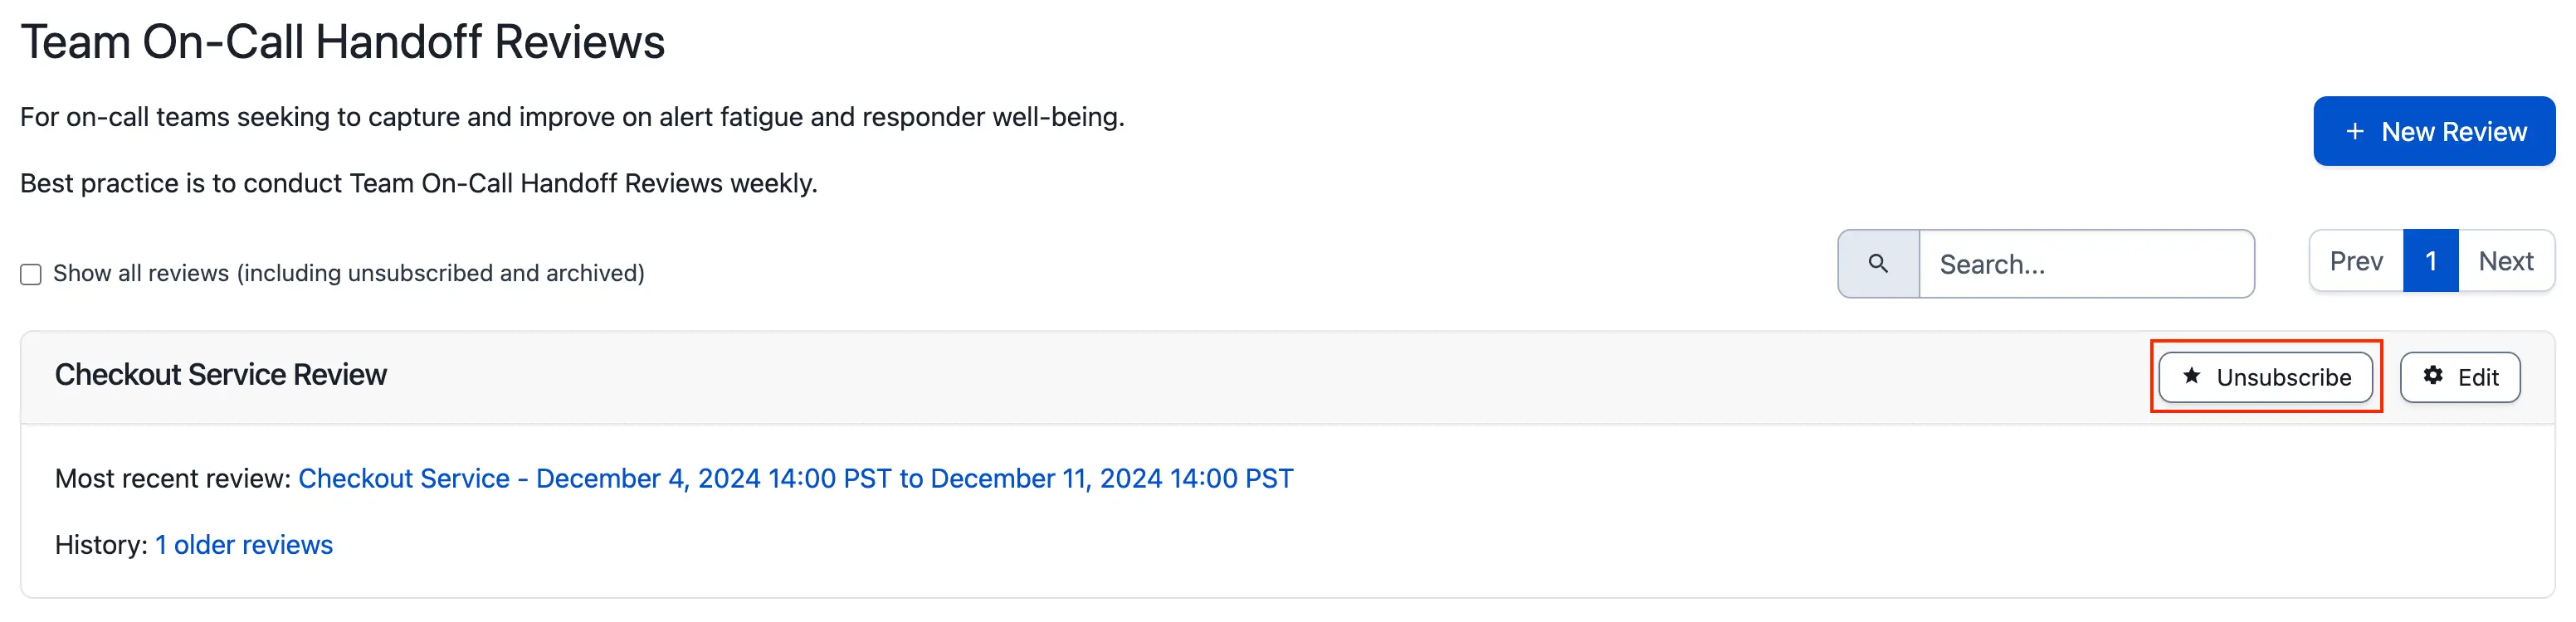
Unsubscribe from a review
Create a Custom Review
Custom reviews allow you to generate reviews across multiple, often unrelated teams. A custom review generates for the first time at the end of the time period set during creation. For example, if you create a review on Tuesday that spans Monday 8:00am through Monday 7:59am, the first review appears on the following Monday.
- Navigate to Analytics Operational Reviews, click Browse Reviews under the desired review type, and click New Review.
- On the next screen, enter the following:
| Field | Value |
|---|---|
| Review Name | A meaningful name that reflects the intended purpose of the review meeting (e.g., "Customer Support, Data, Web Triage - Team On Call Handoff Review"). |
| Team | Search and select the team or teams you would like to review. |
| Frequency (Team On-Call Handoff Reviews only) | Select the number of weeks between reviews, and the date and time when you would like the review to generate. |
- Click Save to create your custom review.
Edit Reviews
Default Team On-Call Handoff Reviews allow you to edit the number of weeks, days of the week, and hour of day that they generate. Custom reviews of any type allow you to edit any aspect that was configurable at creation. Default Service Performance Reviews and Business Performance Reviews are not currently editable.
To edit a review:
- Navigate to Analytics Operational Reviews and click Browse Reviews under your desired review type.
- Search for the desired review and click Edit on the right side.
- Edit the available details and click Save.
Delete Team On-Call Handoff Reviews
You can only delete Team On-Call Handoff reviews.
InfoYou cannot delete Service Performance and Business Performance reviews. Clicking Unsubscribe hides unwanted reviews from your list.
To delete a Team On-Call Handoff review:
- Navigate to Analytics Operational Reviews and click Browse Reviews under the Team On-Call Handoff review type.
- Search for the desired review and click Edit on the right side.
- Click Delete on the right, then click Delete Review in the confirmation prompt.
Search for a Review
Each review type list — Team On-Call Handoff, Service Performance, and Business Performance — includes a search capability that allows you to locate specific reviews quickly. Navigate to Analytics Operational Reviews, select the name of the desired review type, and search for the desired team or review name.
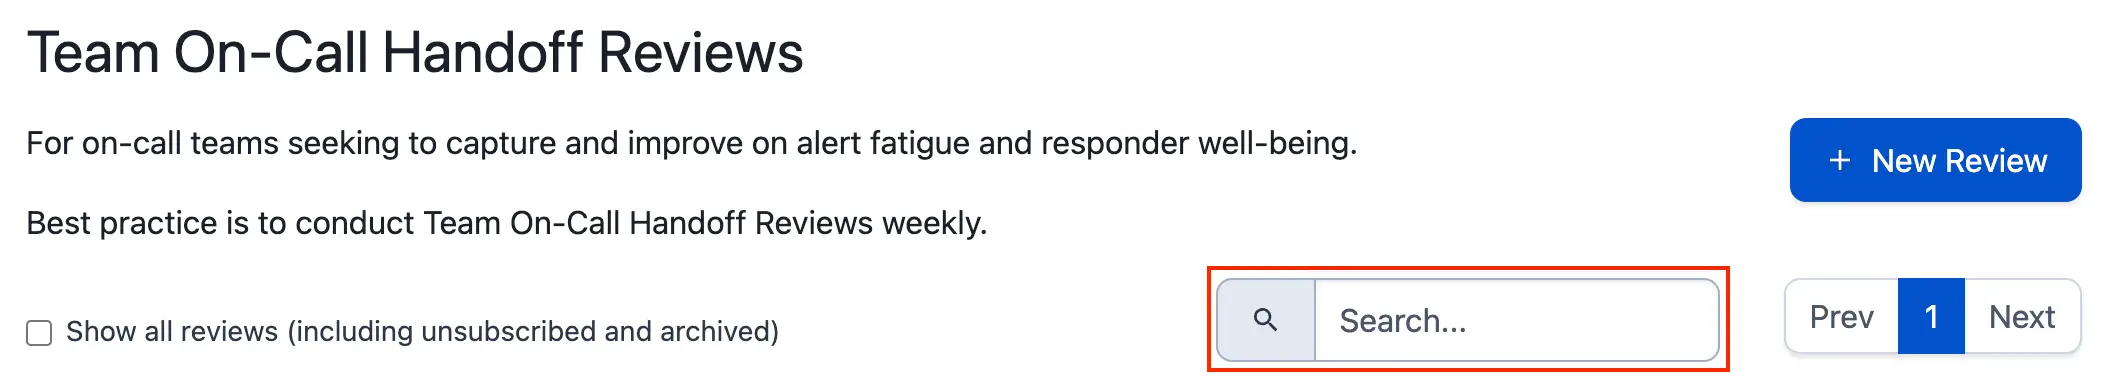
Search for a review
Review Types
InfoFor each review type, sparklines compare the most recent review period to the four previous periods to show how metrics are trending. To the left of each sparkline, the metric for the current period appears. Below each sparkline, the metric for the Last period and the percent change between the two periods appear.
Team On-Call Handoff Reviews
Team On-Call Handoff Reviews help teams capture and improve alert fatigue and responder well-being. The metrics focus on interruptions to responders during business hours, off hours, and sleep hours, as well as MTTA/MTTR, escalations, and the most frequent incidents. Team On-Call Handoff Reviews generate every Monday by default.
Metrics
Team Metrics:
- Major Incidents: Count of incidents on the team's technical services with high priority (P1, P2) or severity (Sev-1, Sev-2), and/or requiring more than one responder.
- High Urgency Incidents: Count of high urgency incidents within the time period designated for the review.
- High Urgency Incident MTTR: Average mean time to resolve (MTTR) for high urgency incidents.
- Off Hours Interruptions: The count of interrupting notifications sent between 6pm and 10pm Monday to Friday, or all day over the weekend, in the user's local time.
- Escalations: Total count of escalations that occurred in the team's weekly report, including both manual and time-out escalations.
- High Urgency Incident MTTA: The mean time to acknowledge (MTTA) for high urgency incidents.
- Sleep Hours Interruptions: The count of interrupting notifications sent between 10pm and 8am, in the user's local time.
- Loudest Service: The service that sends out the highest number of unique interrupting notifications.
- Loudest Incident: The single incident with the highest number of interrupting notifications sent until resolution.
- Interruptions By Service: A breakdown of interruptions per service, displayed in a pie chart.
Individual Metrics:
- Company Averages This Period: The average interruption summary among incident responders for a specified time period. PagerDuty takes all individuals interrupted at least once, uses their time zones to determine when interruptions occurred, and divides the totals by the number of interrupted individuals for the time period. This data surfaces comparisons at the team individual level to highlight whether any member experienced below or above average operational load relative to peers.
- Average Hours Interrupted: The number of hours in a day where a user receives one or more interrupting notifications. The maximum is 24 per day.
- Average Total Interruptions: The average total interruptions per user in the time range designated by the review.
- # Responders Interrupted This Period: Number of responders interrupted in the period designated by the review. Each listed user also displays a Current Vibe:
- Sad face: Any responder interrupted once during sleep hours, twice during off hours, or more than five times in total.
- Neutral face: Any responder with one off hours interruption and five or fewer business hours interruptions.
- Happy face: Any responder who received no off hours or sleep hours interruptions and has fewer than five total interruptions.
- Most Frequent Incidents: Recurring and interrupting incidents with identical descriptions. Each metric includes the incident Description and total count of Interruptions.
- Incidents from this report: A table of incidents included in this report's data.
Service Performance Reviews
Service Performance Reviews guide investments into service performance. The metrics focus on aggregate measurements such as time without major incidents, MTTR for major and high urgency incidents, and a breakdown of incidents and services that may warrant the most attention and investment. Service Performance Reviews generate on the 1st of every month by default.
Metrics
- Time W/O Major Incident: The total amount of time during the reporting period without an open major incident. Concurrent major incidents are counted together as a single measure.
- Time W/O High Urg. Incident: The calculated net duration of high-urgency incidents in a month (removing any overlapping time) and the calculated percentage of time without high-urgency incidents.
- Major Incident MTTR: Average mean time to resolve (MTTR) for incidents on the service with priority (P1, P2) or severity (Sev-1, Sev-2), and/or requiring more than one responder.
- High Urgency Incident MTTR: Average mean time to resolve (MTTR) for high urgency incidents on the service.
- Major Incidents Count: Count of major incidents.
- High Urgency Count: Count of high urgency incidents.
- Longest Major Incident TTR: The longest time to resolve (TTR) on a major incident.
- Longest Urgent Incident TTR: The longest time to resolve (TTR) on a high urgency incident.
- Longest Incident Duration (High Urg.): The longest total duration from trigger to resolution on a high urgency incident.
- Loudest Services: The technical services with the highest number of interrupting notifications.
- Most Frequent Incidents: Recurring and interrupting incidents with identical descriptions.
- Business Service At Risk: A measure of service stability based on the amount and duration of incidents on technical services mapped to business services in your system. PagerDuty calculates this in two ways:
- The business service with the longest single major incident, calculated by adding up the overlapping total major incident durations on the technical services that support a business service (flattening the time).
- The business service with the highest major incident volume, calculated by adding up the major incident count on the technical services that support a business service.
- Worst Performing Technical Services: Services with the largest number of incidents. Incident count includes both high and low-urgency incidents. Business service affiliations and team associations for the technical service also appear here.
Business Performance Reviews
Business Performance Reviews provide business and technology leaders with insight into how service operations affect business outcomes. The metrics focus on the company cost of operating services (hours lost responding, cost of responder time), the impact on customers (aggregate major incident duration), and a summary of high-impact incidents from the quarter. Business Performance Reviews generate every calendar quarter (April 1st, July 1st, October 1st, and January 1st) by default.
Metrics
- Time W/O Major Incident: The total amount of time during the reporting period without an open major incident. Concurrent major incidents are counted together as a single measure.
- Est. Response Cost: The estimated cost, in US dollars, that your company spent on employee incident response. This is a fixed cost calculation of $50 per hour.
- Responder Cost in Hours: The actual cost in people/labor hours that your company spent on employee response to major incidents (each engaged responder's time from acknowledgement to resolution). This is also known as your responder burn rate.
- Major Incidents: Count of incidents on the team's technical services with priority (P1, P2) or severity (Sev-1, Sev-2), and/or requiring more than one responder.
- Major Incident MTTR: The mean time to resolve (MTTR) for major incidents.
- Most Time in Response: The top three teams affected by major incidents, along with the number of major incidents, cost in hours, and the percentage of time spent on unplanned effort caused by those incidents.
- Business Services At Risk: A measure of service stability based on the amount and duration of incidents on technical services mapped to business services in your system. PagerDuty calculates this in two ways:
- The business service with the longest single major incident, calculated by adding up the overlapping total major incident durations on the technical services that support a business service (flattening the time).
- The business service with the highest major incident volume, calculated by adding up the major incident count on the technical services that support a business service.
- Technical Services Hit List: A list of three services in order of worst affected that need the most attention based on frequency of major incidents. The three worst services are determined by the Time w/o Major Incident metric, with the lowest times shown first.
- Major Incident Details: The Est. Response Cost, Duration, Technical Service, and Business Services Affected for each major incident.
FAQ
I just had the Operational Reviews feature enabled, why don't I see any reviews yet?
After enablement, it can take approximately one hour to analyze your account's data. Ensure you are assigned to at least one Team so that team reviews can generate.
Why don't I see all my Teams on my Team On-Call Handoff Reviews?
After the feature is enabled, all existing teams have a review generated. However, teams created after enablement do not have reviews added automatically. To generate reviews for new teams, click the New Review button.
How are my default reviews determined, and how do I change what reviews I can see?
Your reviews generate based on the teams you are on. To view reviews for a team you are not on, you must join that team or create a custom review that covers the team with your desired data.
How do Operational Reviews deal with different time zones?
Time zones are used in three ways:
- To determine business, off, and sleep hours.
- To display the time of an incident.
- To determine the date and time range that a review covers.
When determining whether an interruption occurred during business, off, or sleep hours, PagerDuty uses the time zone set on your profile. If you have not set a time zone, your profile inherits the account time zone.
When displaying the details of a specific incident in a review, PagerDuty displays time based on your time zone. If you have not set a time zone, your profile inherits the account time zone.
When creating a review, you select the time range based on the displayed account time zone. Default reviews generate on weekly, monthly, and quarterly cadences based on the account time zone.
Are incident times based on when they were created or when they were resolved?
Results include only the incidents created within the selected timeframe.
Updated 21 days ago