
PD Reliability Console
An overview of the PagerDuty Reliability Platform Console
The PD Reliability Console is your operational home for incident response — a single, real-time view of incidents, on-call coverage, and PagerDuty agent activity. It builds on the existing Operations Console, adding visibility to Paige, your SRE Agent, and your Scribe Agent so you can see what your agents are doing alongside the incidents and on-call schedules you already monitor, instead of checking separate pages. The PD Reliability Console can serve as your default landing experience, giving you incidents, on-call status, and agent status in one place as soon as you log in.
AvailabilityThe PD Reliability Console is available to PD Reliability Platform customers only. If your account is on a legacy package, your Operations Console and Incident List are unaffected — this article does not apply to you.
Required User PermissionsAny user can view the PD Reliability Console, including incident data, on-call coverage, and agent status.
Only Admins can enable or configure PagerDuty agents from the console. If you do not have Admin permissions, you can drill into a not-enabled agent and send an activation request to your Admin directly from the Agents drawer.
View the PD Reliability Console
In the web app, select Console from the left menu.
Default Landing ExperienceThe PD Reliability Console opens automatically as the first page you see after you log in to the web app. Select a different page from the left menu to navigate elsewhere.
PagerDuty Agents in the PD Reliability Console
The PD Reliability Console shows the enablement status of four PagerDuty agents: SRE Agent, Scribe Agent, Insights Agent, and Shift Agent.
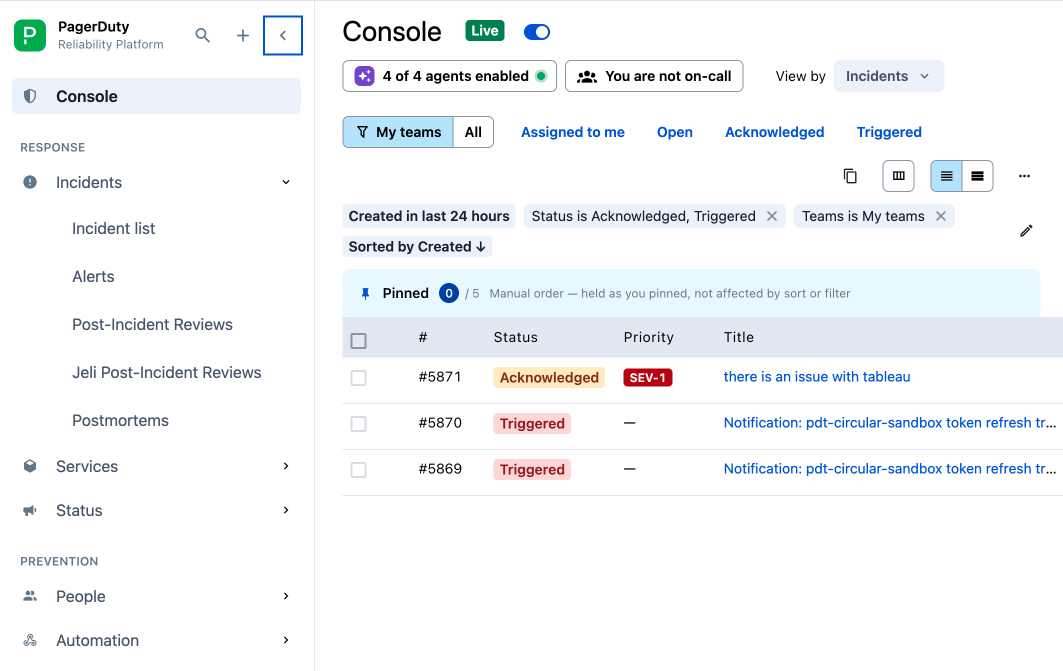
PDRP Console
AI Agents Widget
The AI status widget highlights if an agent has been enabled. Click the widget to open the Agents drawer.
Each agent row shows a description of what the agent does. If an agent is enabled, it shows the surfaces it is connected to (for example, the SRE Agent may show connections to Slack, Datadog, and GitHub; the Scribe Agent may show connections to Zoom, Slack, or Microsoft Teams).
The Agents drawer covers:
- SRE Agent — investigates incidents, correlates signals, and posts triage findings and recommendations.
- Scribe Agent — captures chat, calls, and timeline updates into the incident record automatically.
- Insights Agent — surfaces patterns, recurring causes, and learnings across services as incidents close.
- Shift Agent — preps on-call handoffs and briefs the incoming responder on open work.
If an agent is not enabled, click Agent Settings to configure the agent.
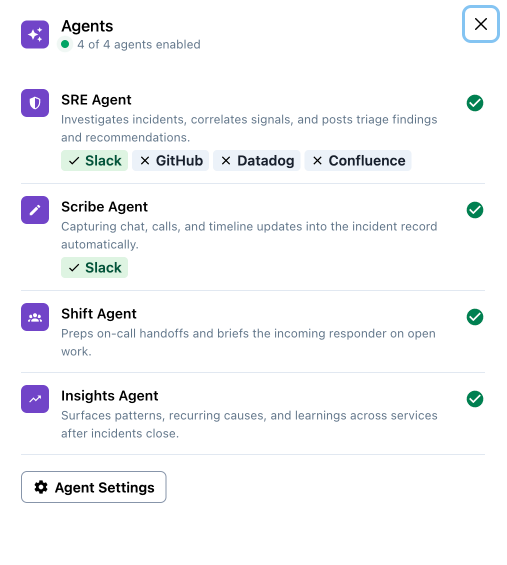
PDRP Console - Agents View
On-Call Widget
The on-call widget shows your current on-call status:
- You are on-call: your avatar with a green dot.
- You are not on-call: a team icon.
Click the on-call widget to open the on-call drawer.
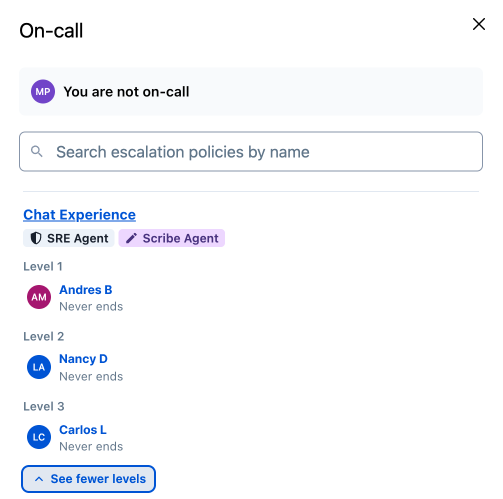
On-Call Widget
Your status card is pinned to the top and lets you know if you are on-call. It also lists:
- Each escalation policy you are on-call for, with your level and when your coverage ends
- Your upcoming shifts, including your next shift if you are not currently on-call.
Below your status card, the roster groups responders by escalation policy. Each escalation policy block shows:
- SRE Agent and Scribe Agent enablement badges for that escalation policy.
- Each on-call level, its responders, and when their shift ends.
Use the search box at the top of the drawer to search by service, escalation policy, or responder.
If you are on more than ten escalation policies, the roster shows the first ten with a link to the full Escalation Policies page.
Shared Operations Console Functionality
The PD Reliability Console uses the same incident table, filtering, and action capabilities as the Operations Console, with the same default columns. Read Operations Console for full instructions on:
- The column selector
- The side panel
- Filters and search, including keyword search
- Incident actions and bulk actions
- Custom Details
- Service Health Visualization
Data Lookback WindowThe PD Reliability Console shows a limited window of incident history where you can see incidents from up to 61 days in the past. To view incidents outside this window, use the Incidents page.
Row and Selection LimitsThe PD Reliability Console holds up to 1,000 rows in memory, with a 50-row cap per bulk action selection — the same limits as the Operations Console.
FAQ
Can I still see incidents older than the console's lookback window?
Yes. Navigate to the Incidents page to view incident history beyond the PD Reliability Console's lookback window.
Who can enable PagerDuty agents from the console?
Only Admins can enable or configure agents. If you do not have Admin permissions, you can send an activation request to your Admin from the Agents drawer.
What happens to my Operations Console if I am not on PD Reliability Platform?
Nothing changes. If your account is on a legacy package, your Operations Console and Incident List continue to work as they do today.
Updated 18 days ago